
Economic Profile
Spendmapp, developed by Geografia, is an economic modelling tool used by several local government areas to measure consumer spending of locals and visitors geographically using bank data. The tool helps local Council’s and businesses gain a better understanding of the local economy by providing an insight into the visitor economy, online expenditure and escape expenditure. Using the data helps determine patterns of spending and can assist with managing and responding to long term economic trends and shocks.
Economic Profile, developed by .id, is a comprehensive economic analysis tool used by Hawkesbury City Council. This resource assists in understanding economic trends, identifying growth sectors, and informing strategic planning for businesses and policymakers. It consolidates data from 11 different datasets, including the Australian Bureau of Statistics and National Economics (NIEIR), to provide insights into the local economy. Key metrics include Gross Regional Product (GRP), local employment figures, industry composition, and building approvals.
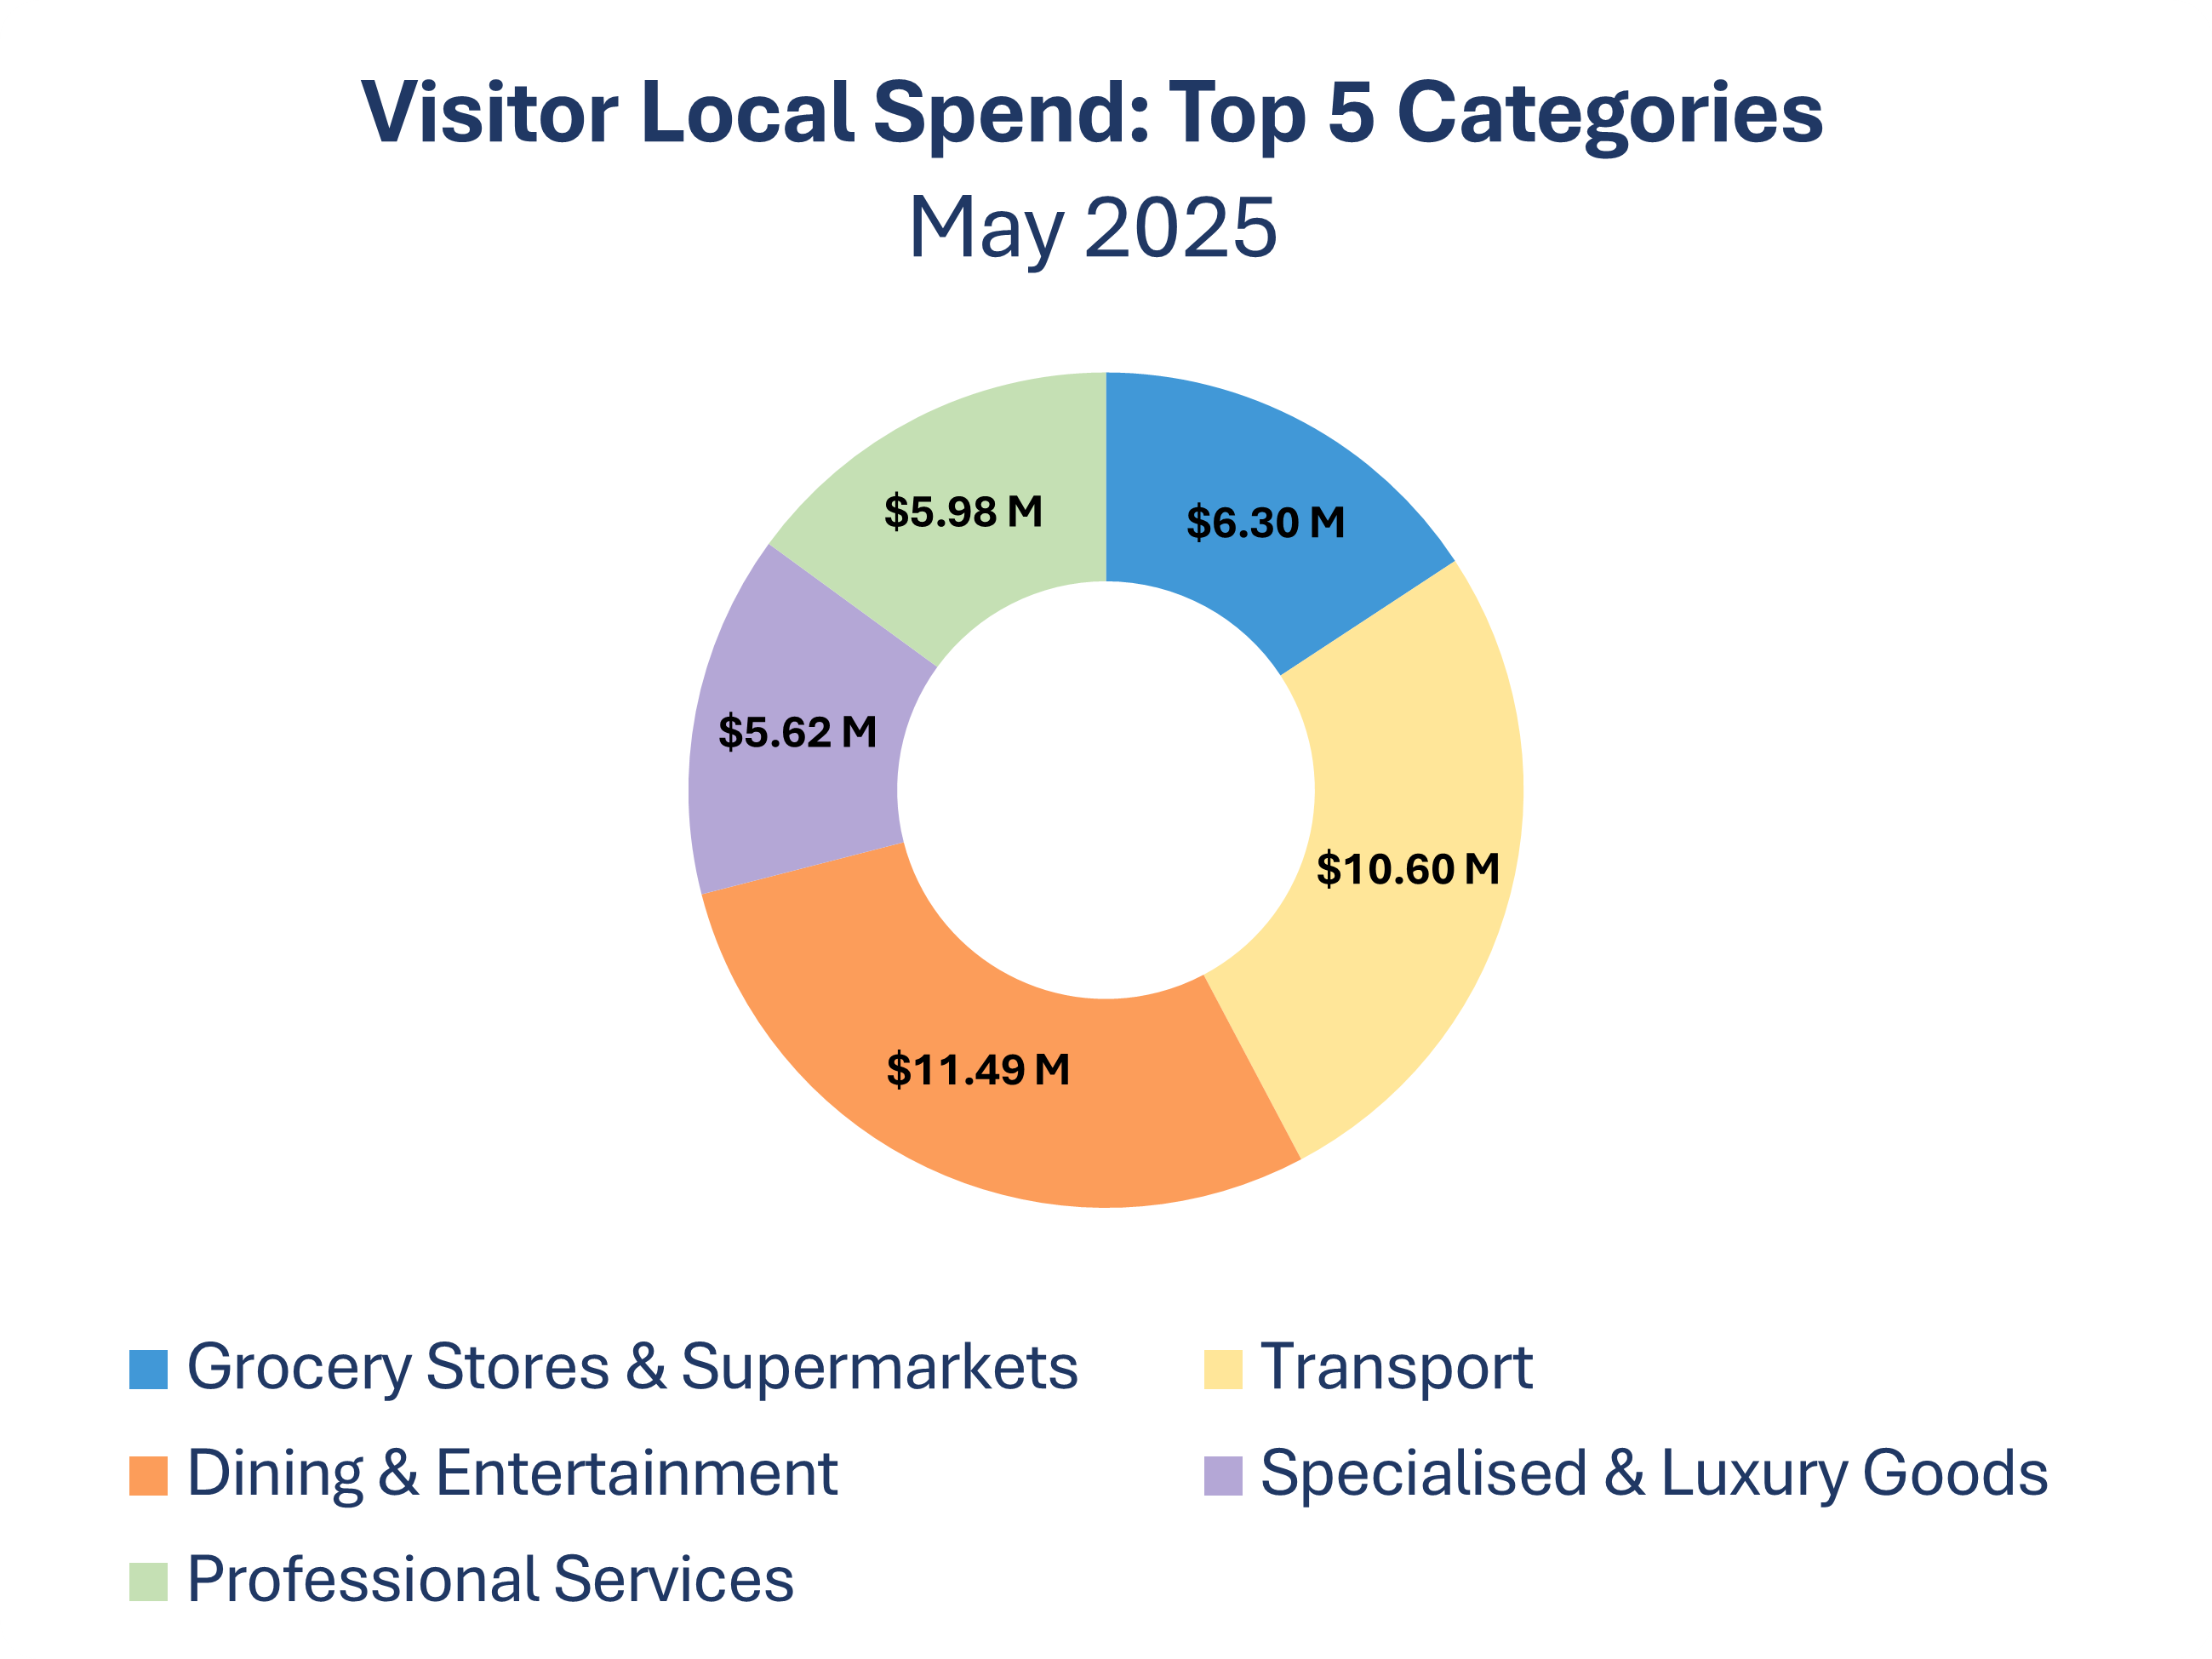
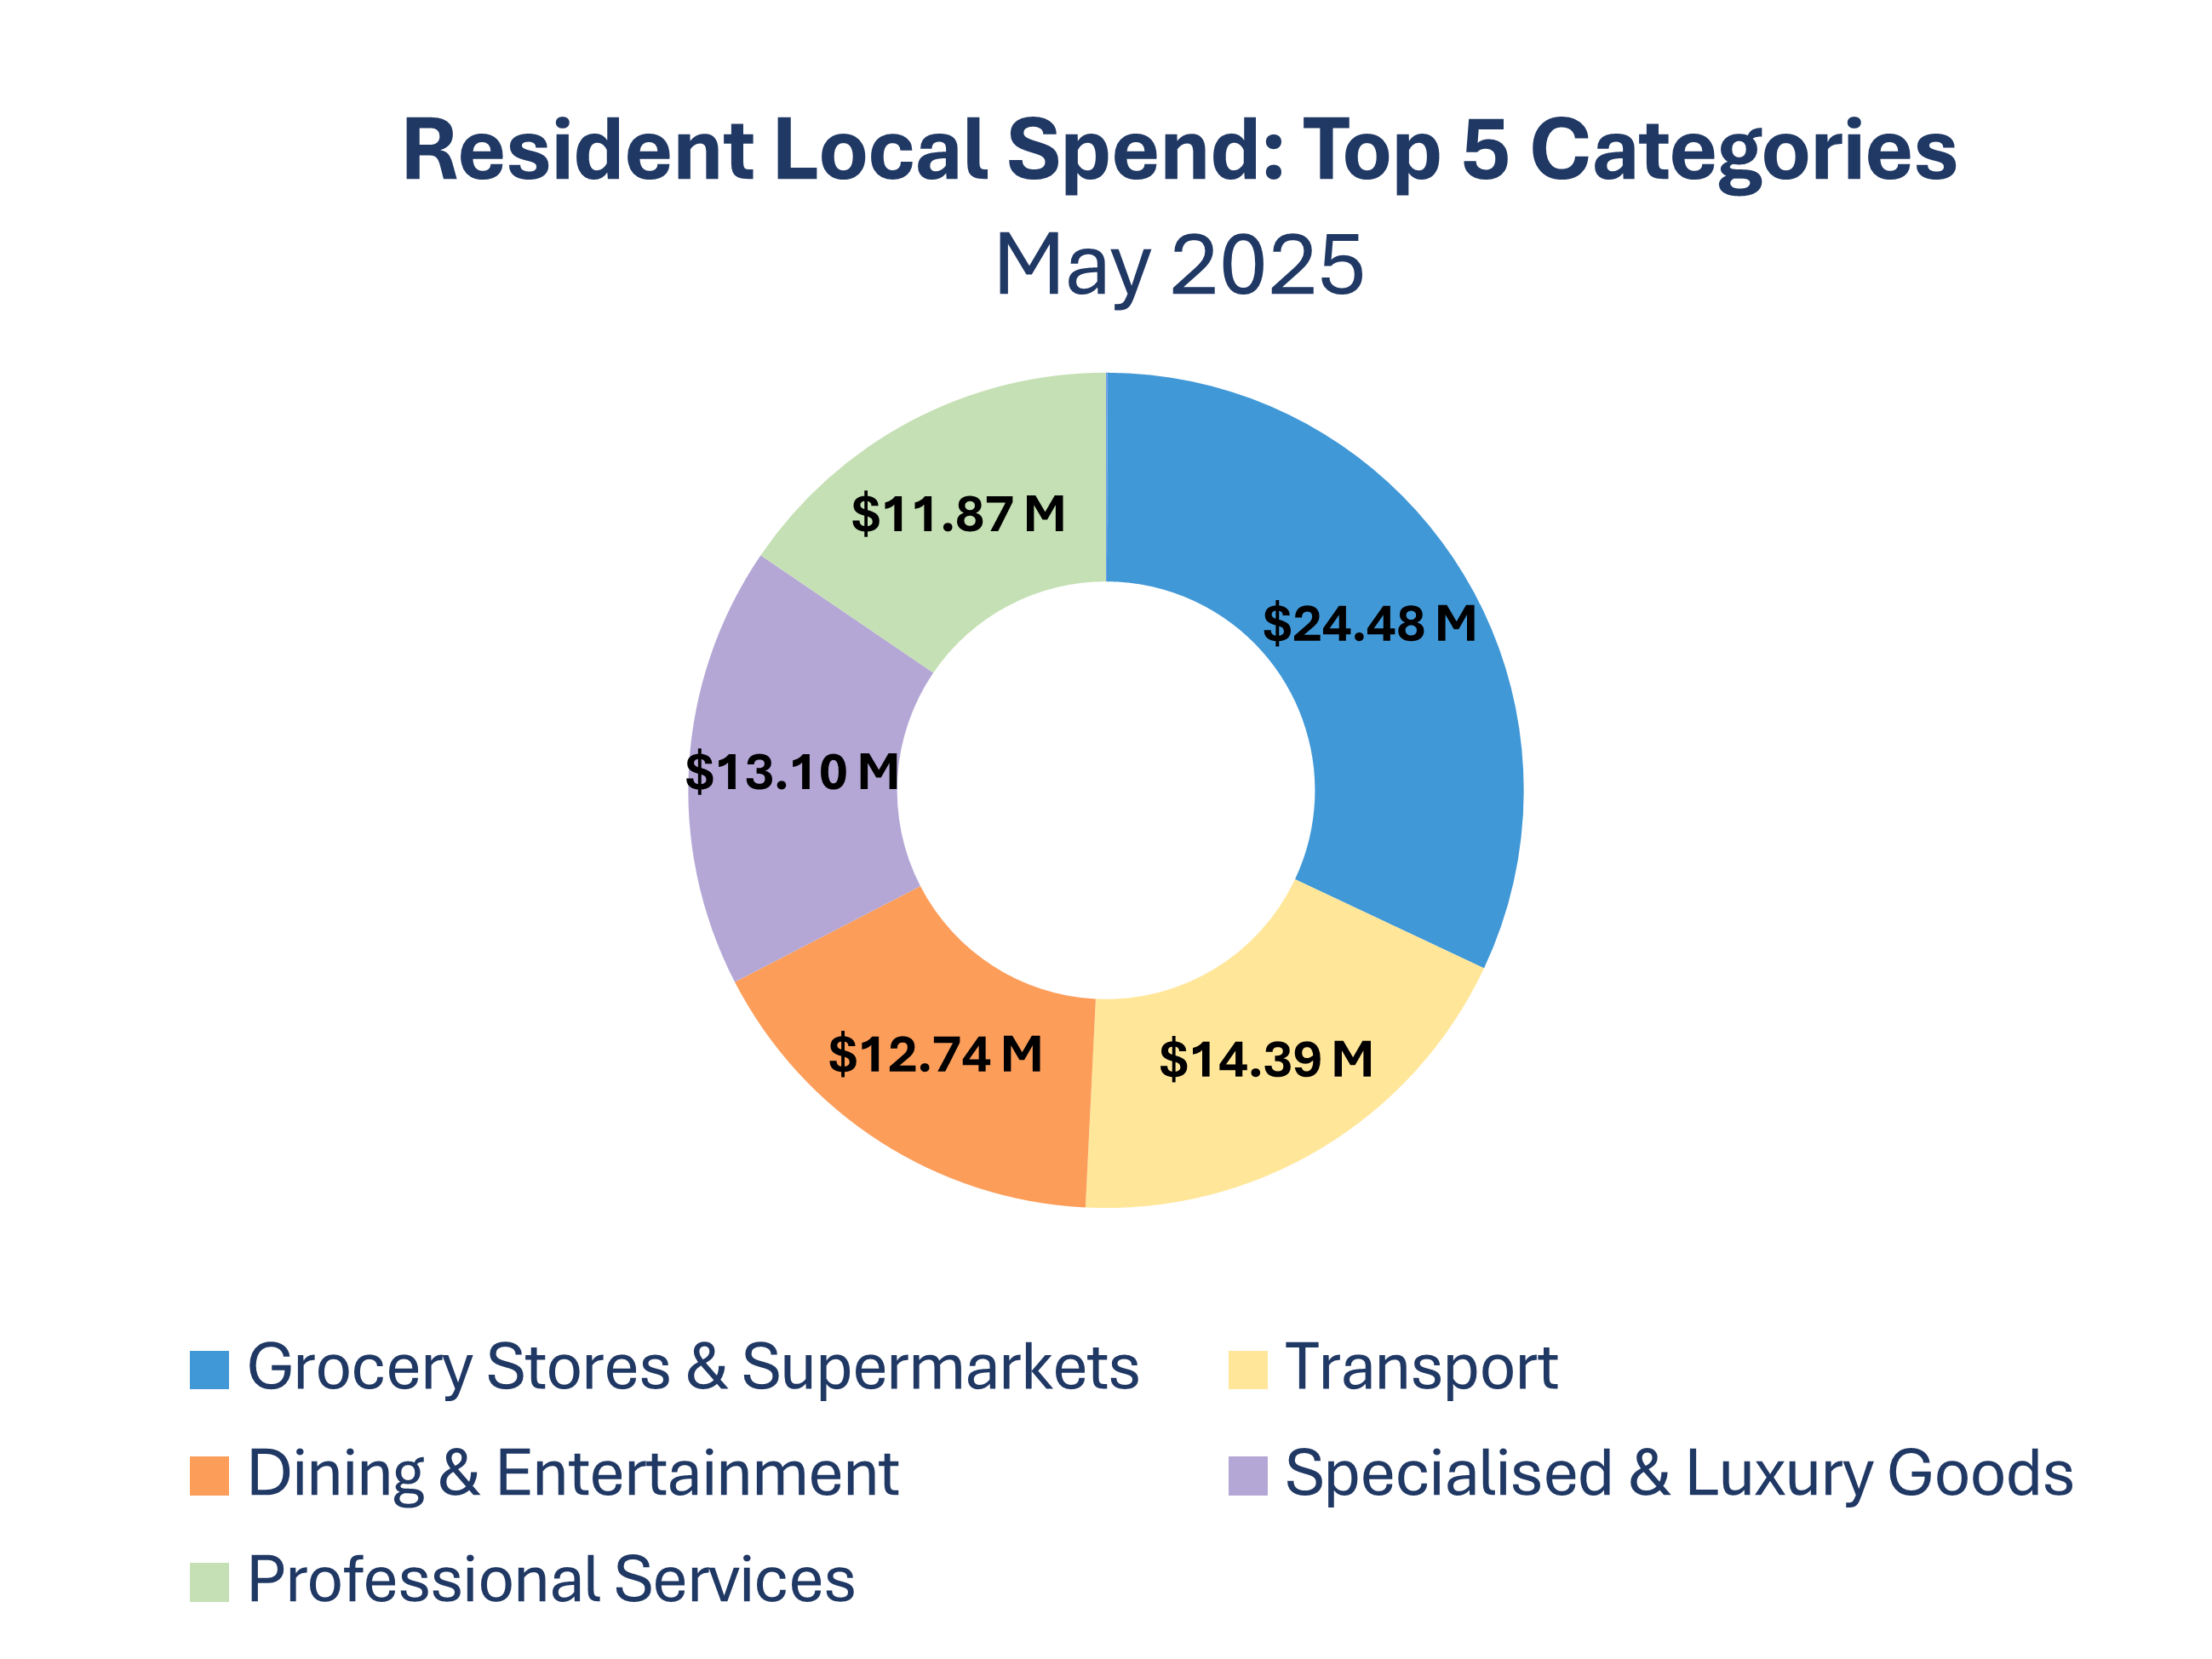
May 2025
Check out the May 2025 monthly report for a breakdown of Hawkesbury's spending.
- Resident Local Spend was $103.0M. This is a 6.0% increase from the previous month.
- Resident Online Spend was $131.0M. This is an 8.8% increase from the previous month.
- Visitor Local Spend was $55.4M. This is a 0.6% increase from the previous month.
- Total Local Spend was $158.3M. This is a 4.0% increase from the previous month.
- Resident Escape Spend was $94.3M. This is a 4.7% increase from the previous month.
Spending remained strong in May, with female consumers slightly outspending males—$79.5M compared to $78.8M. The top spending demographic was females aged 45–54, contributing $17M (up 4.2%). The fastest-growing group, however, was females aged 18–24, whose spending surged by 7.8%, indicating a rise in younger consumer activity.
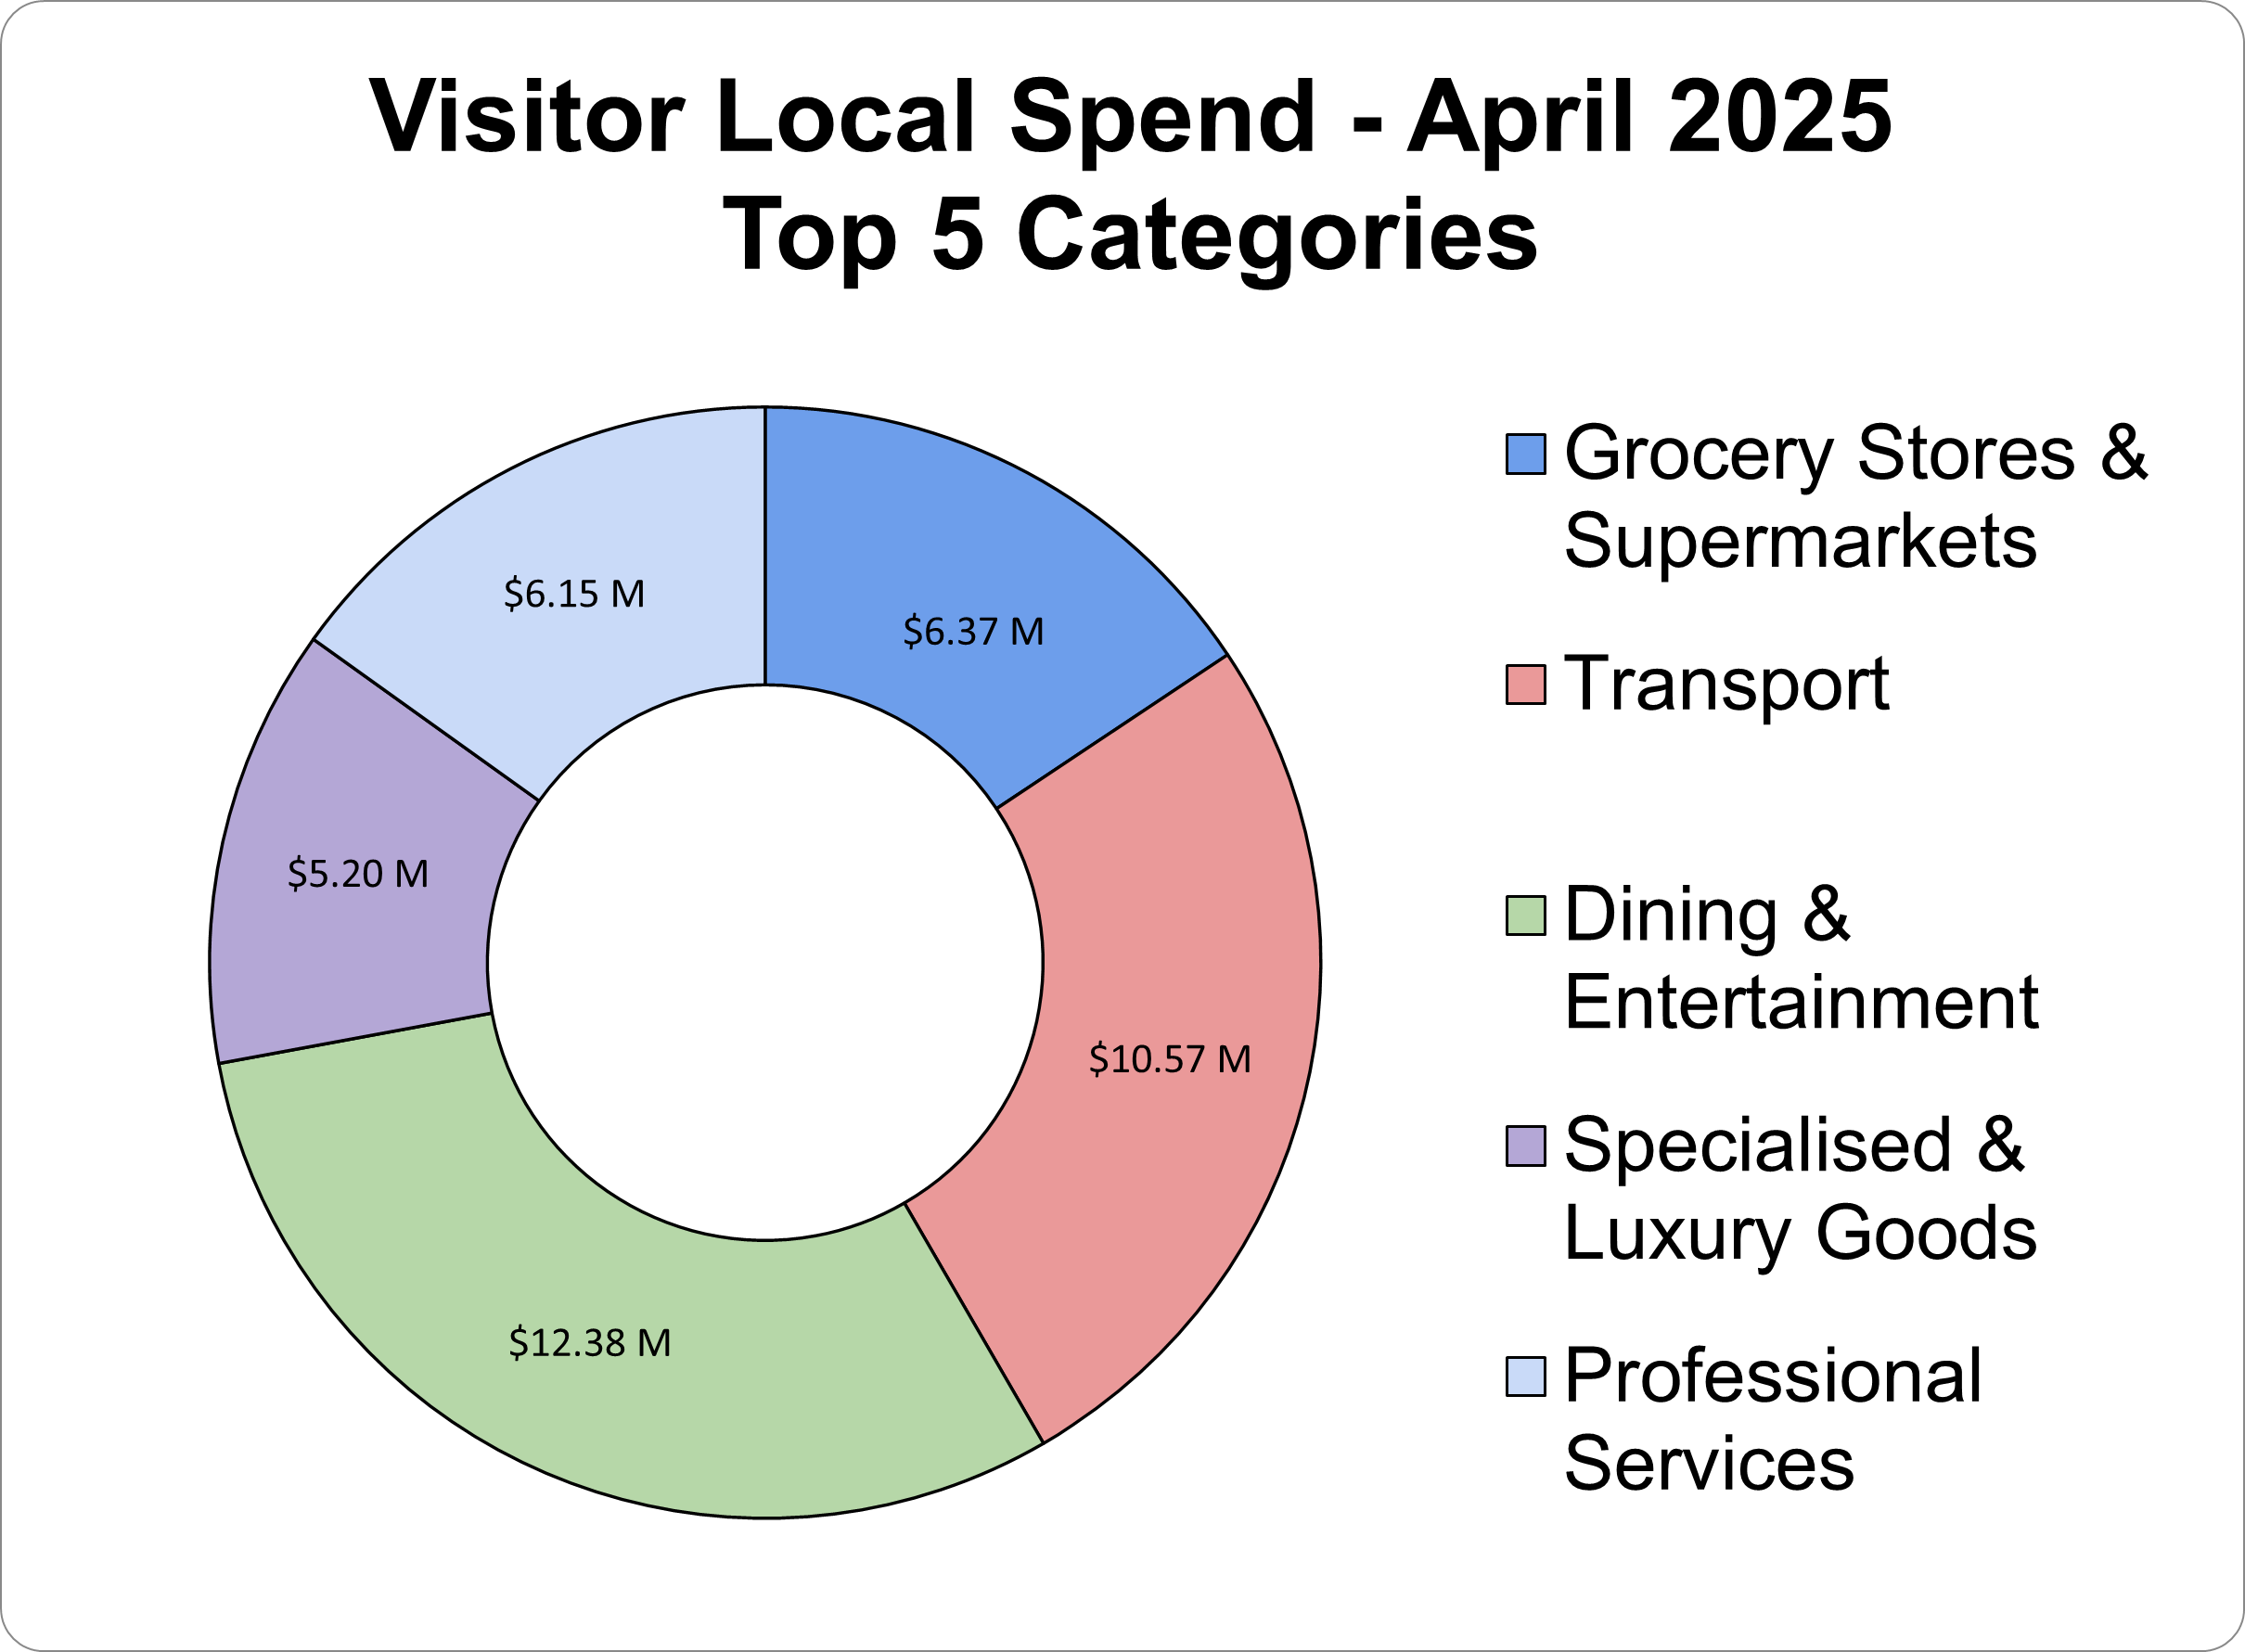
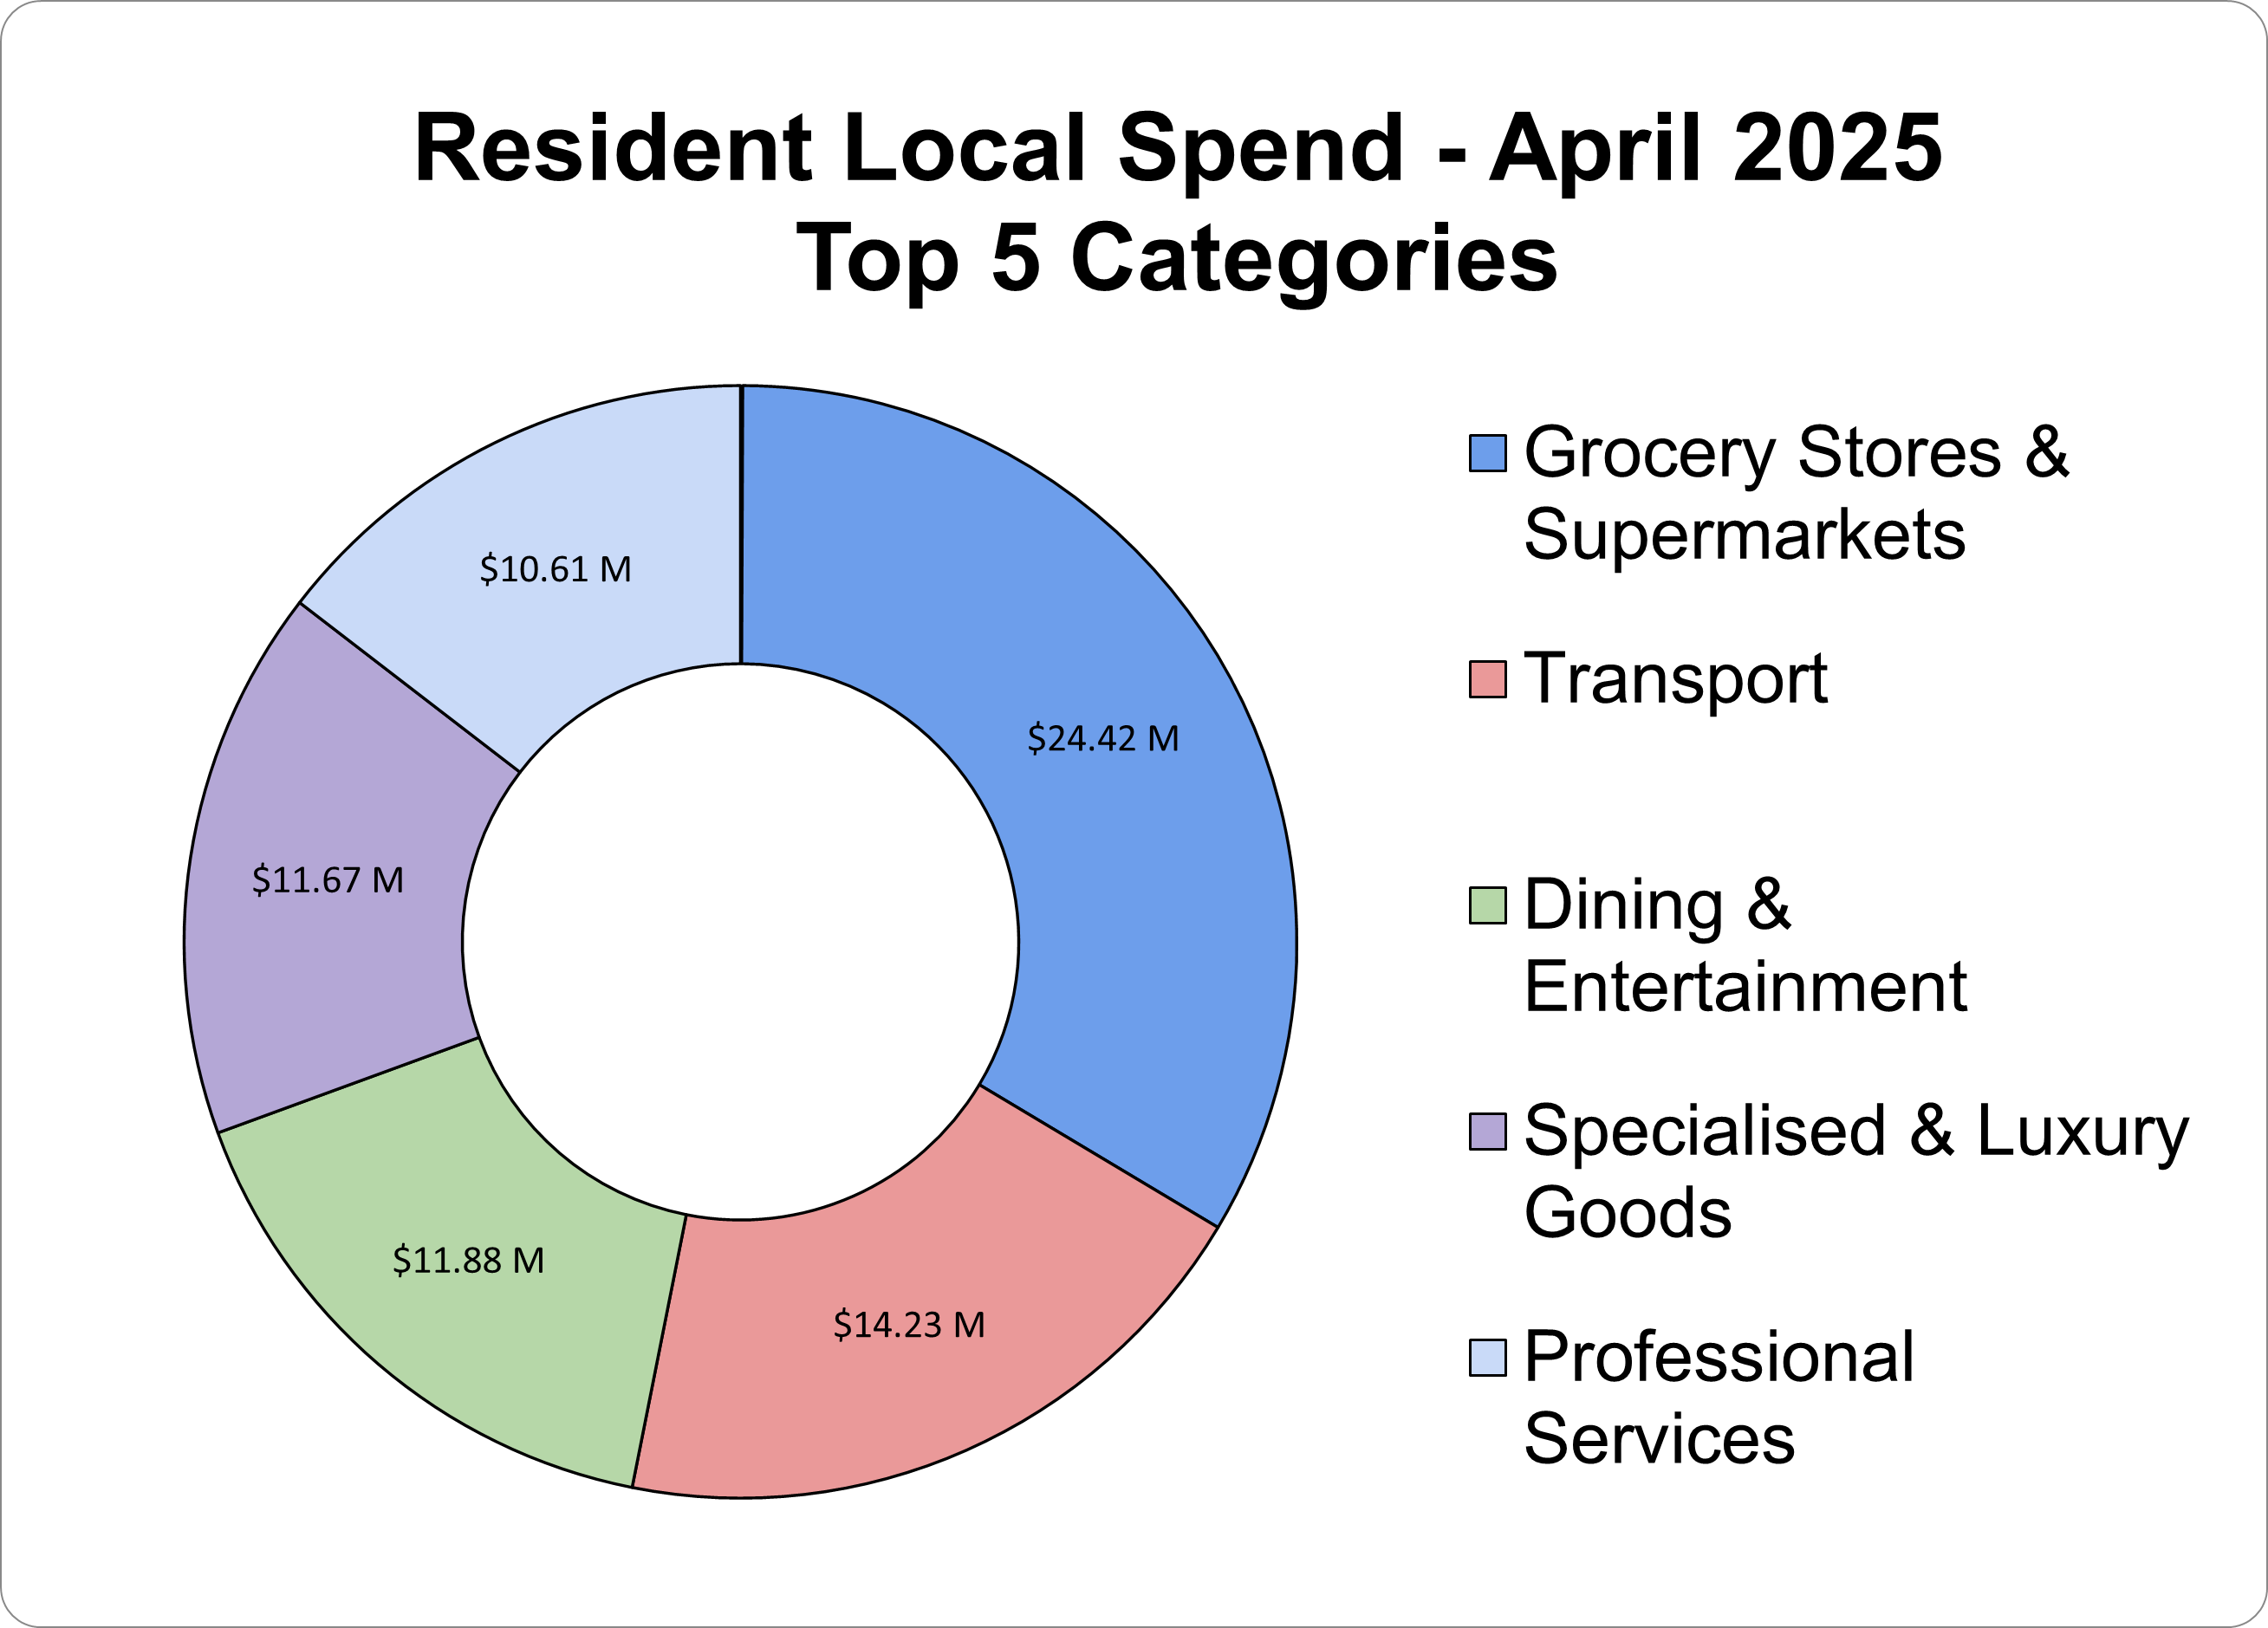
April 2025
Check out the April 2025 monthly report for a breakdown of Hawkesbury's spending.
- Resident Local Spend was $97.0M. This is a 3.9% decrease from March 2025.
- Resident Online Spend was $120.0M. This is a 5.1% decrease from March 2025.
- Visitor Local Spend was $55.0M. This is a 0.1% increase from March 2025.
- Total Local Spend was $152.0M. This is a 2.5% decrease from March 2025.
- Resident Escape Spend was $90.0M. This is a 2.7% decrease from March 2025.
Spending peaked on Thursday, April 17, just before the Easter long weekend. The fastest growing demographic was 25–34-year-old males, with their spending rising by 1.4% compared to March. This demographic trend suggests an opportunity for targeted promotions and services catering to younger male consumers in the region.
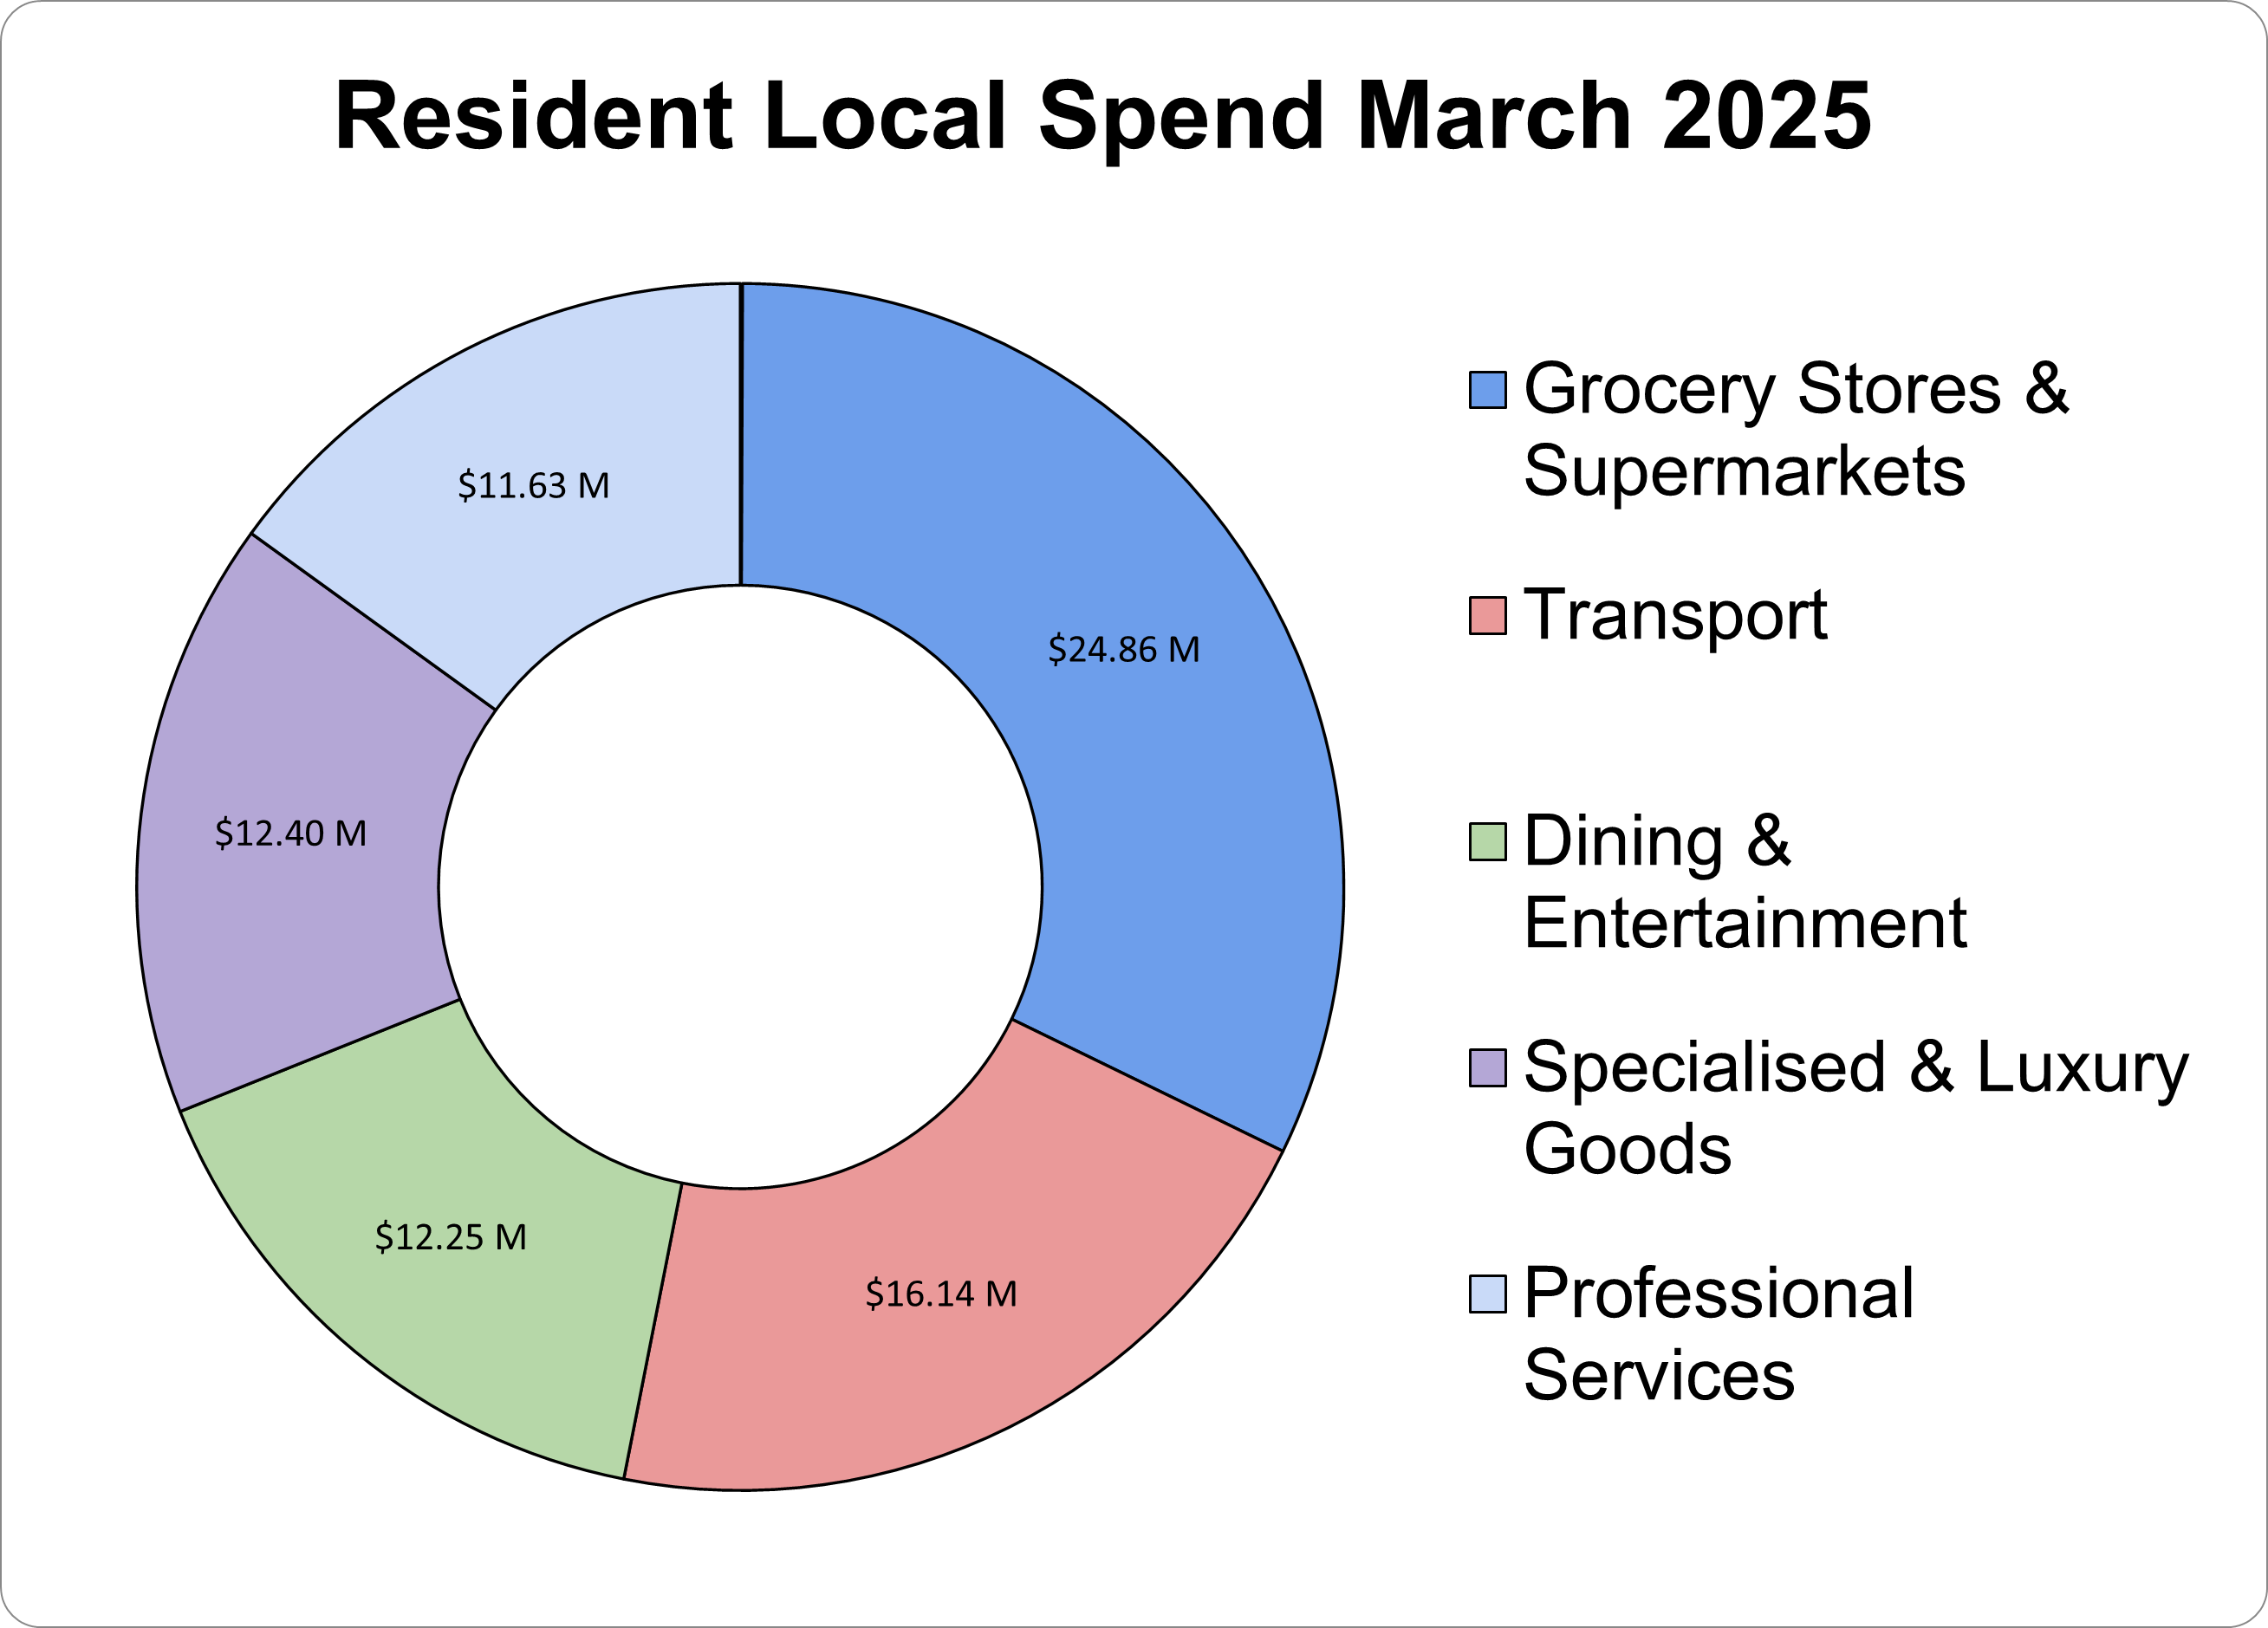
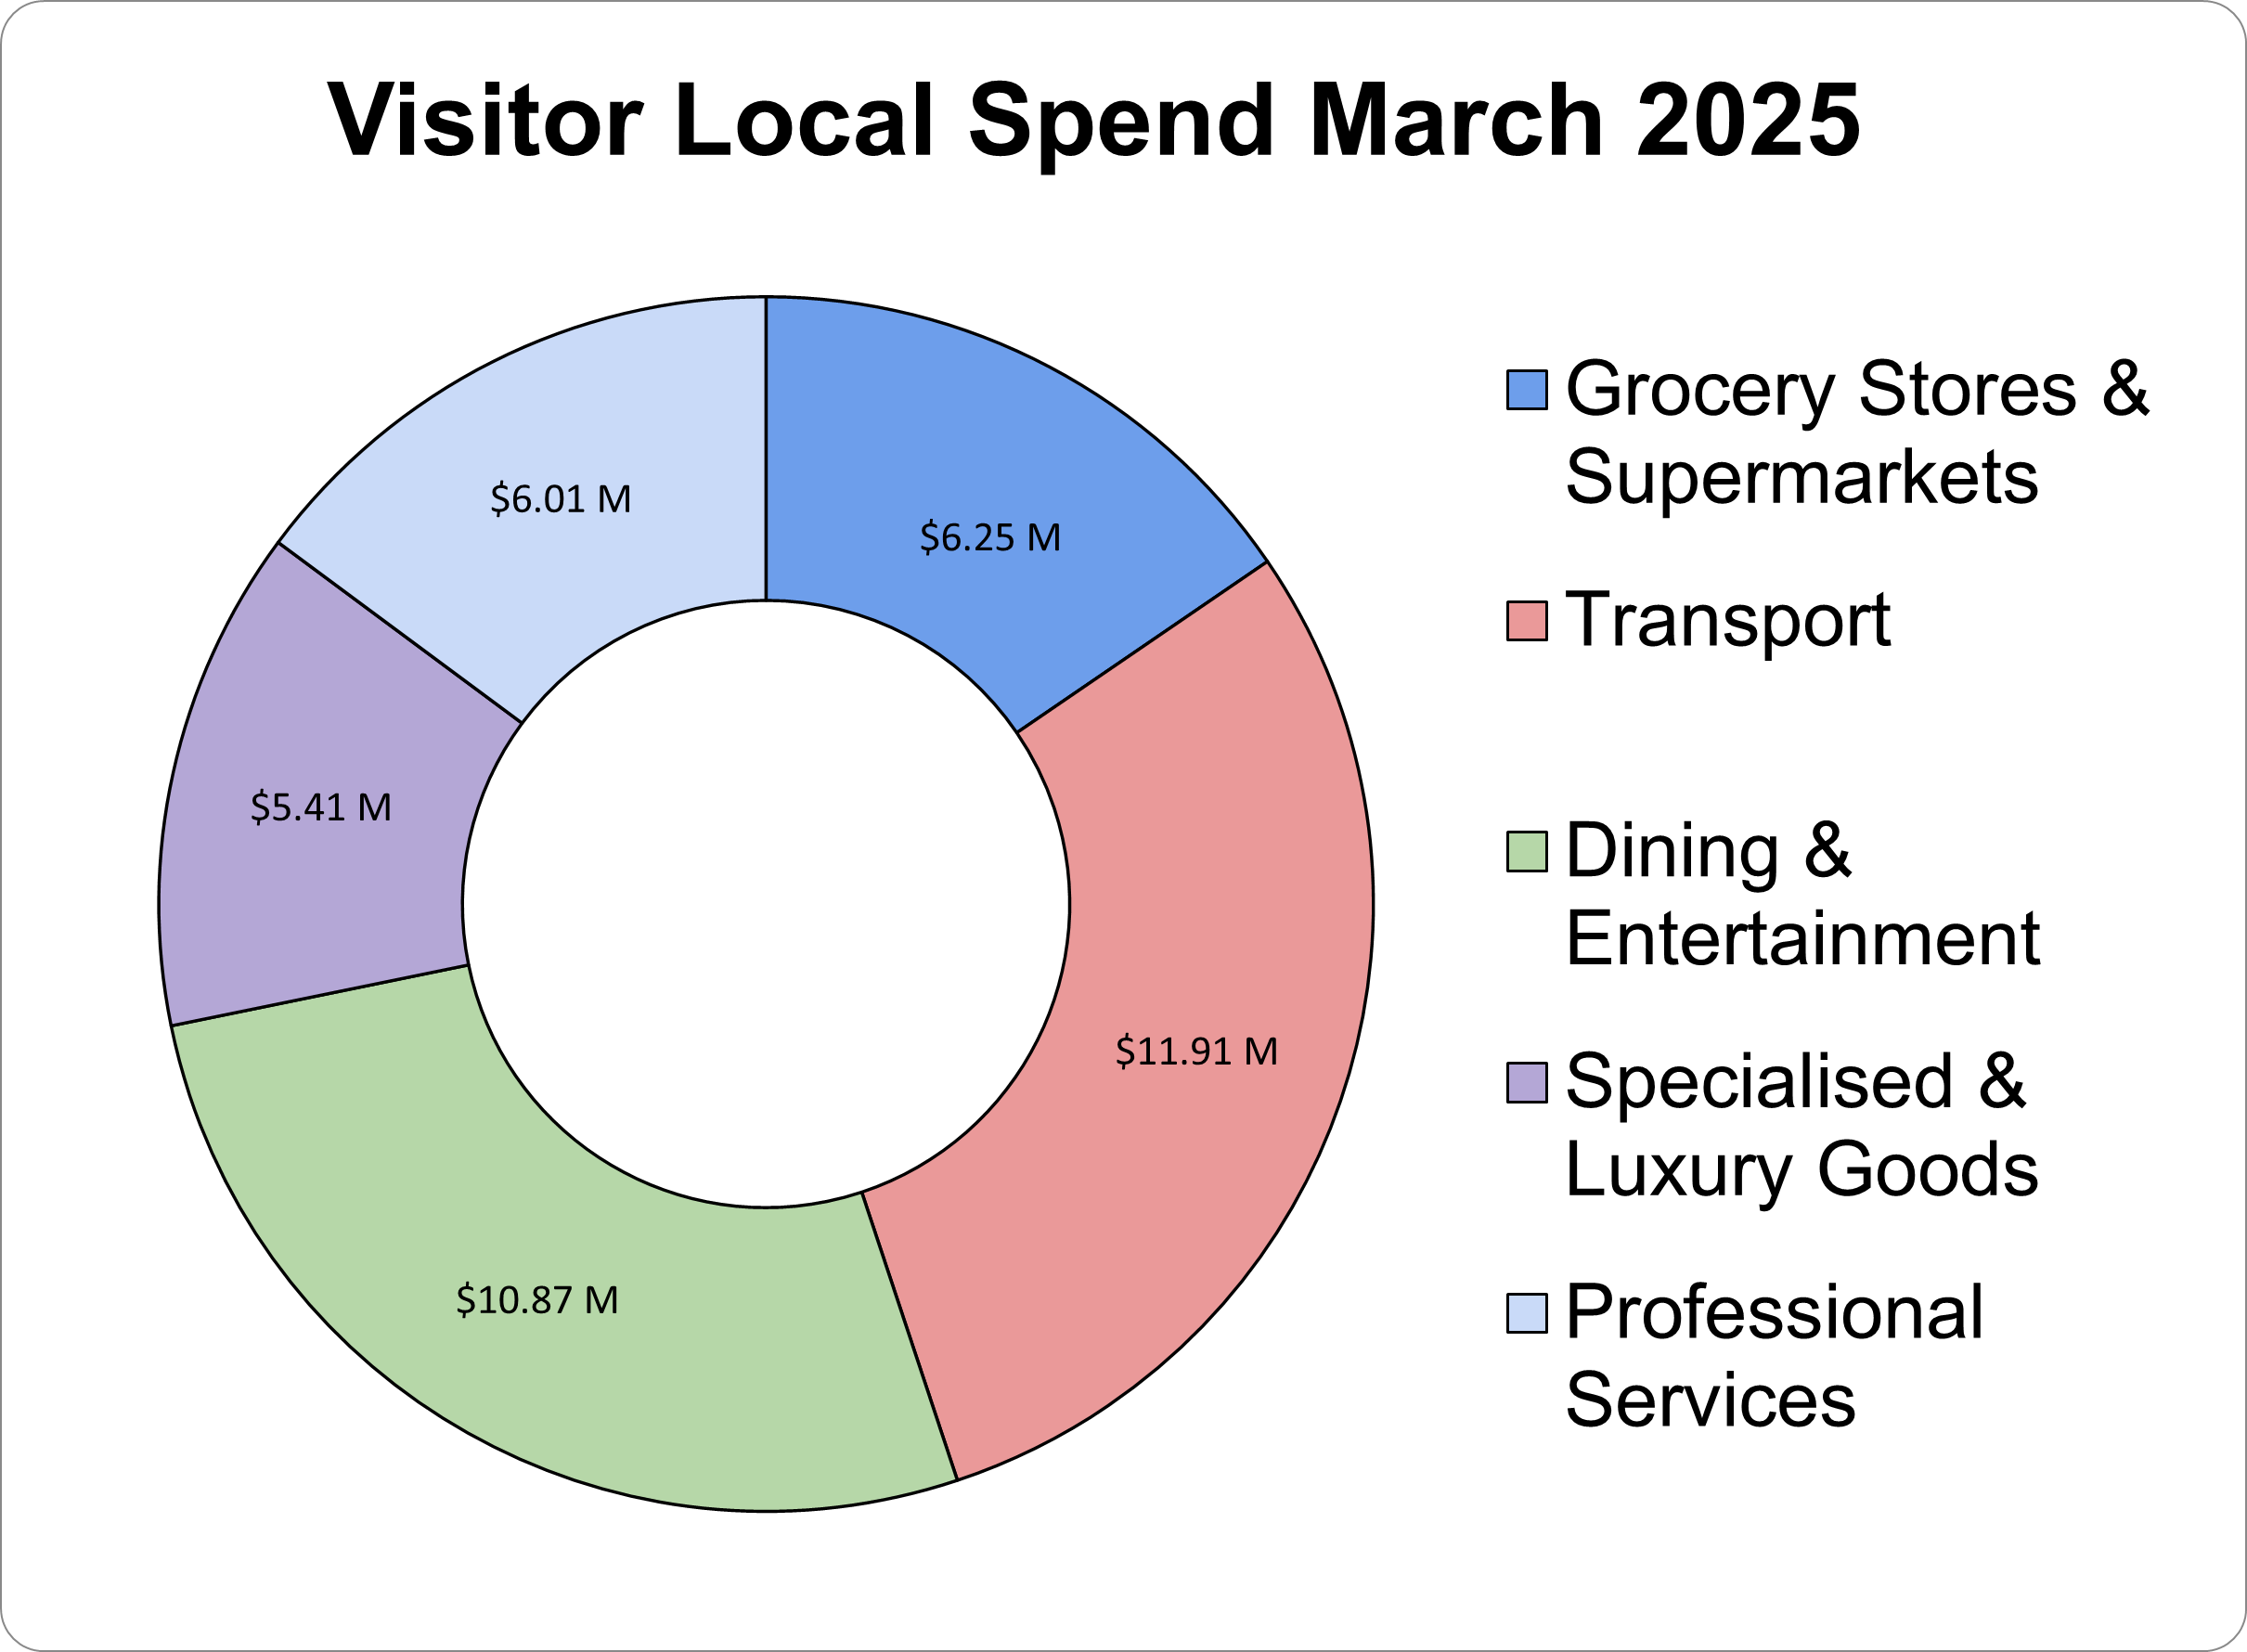
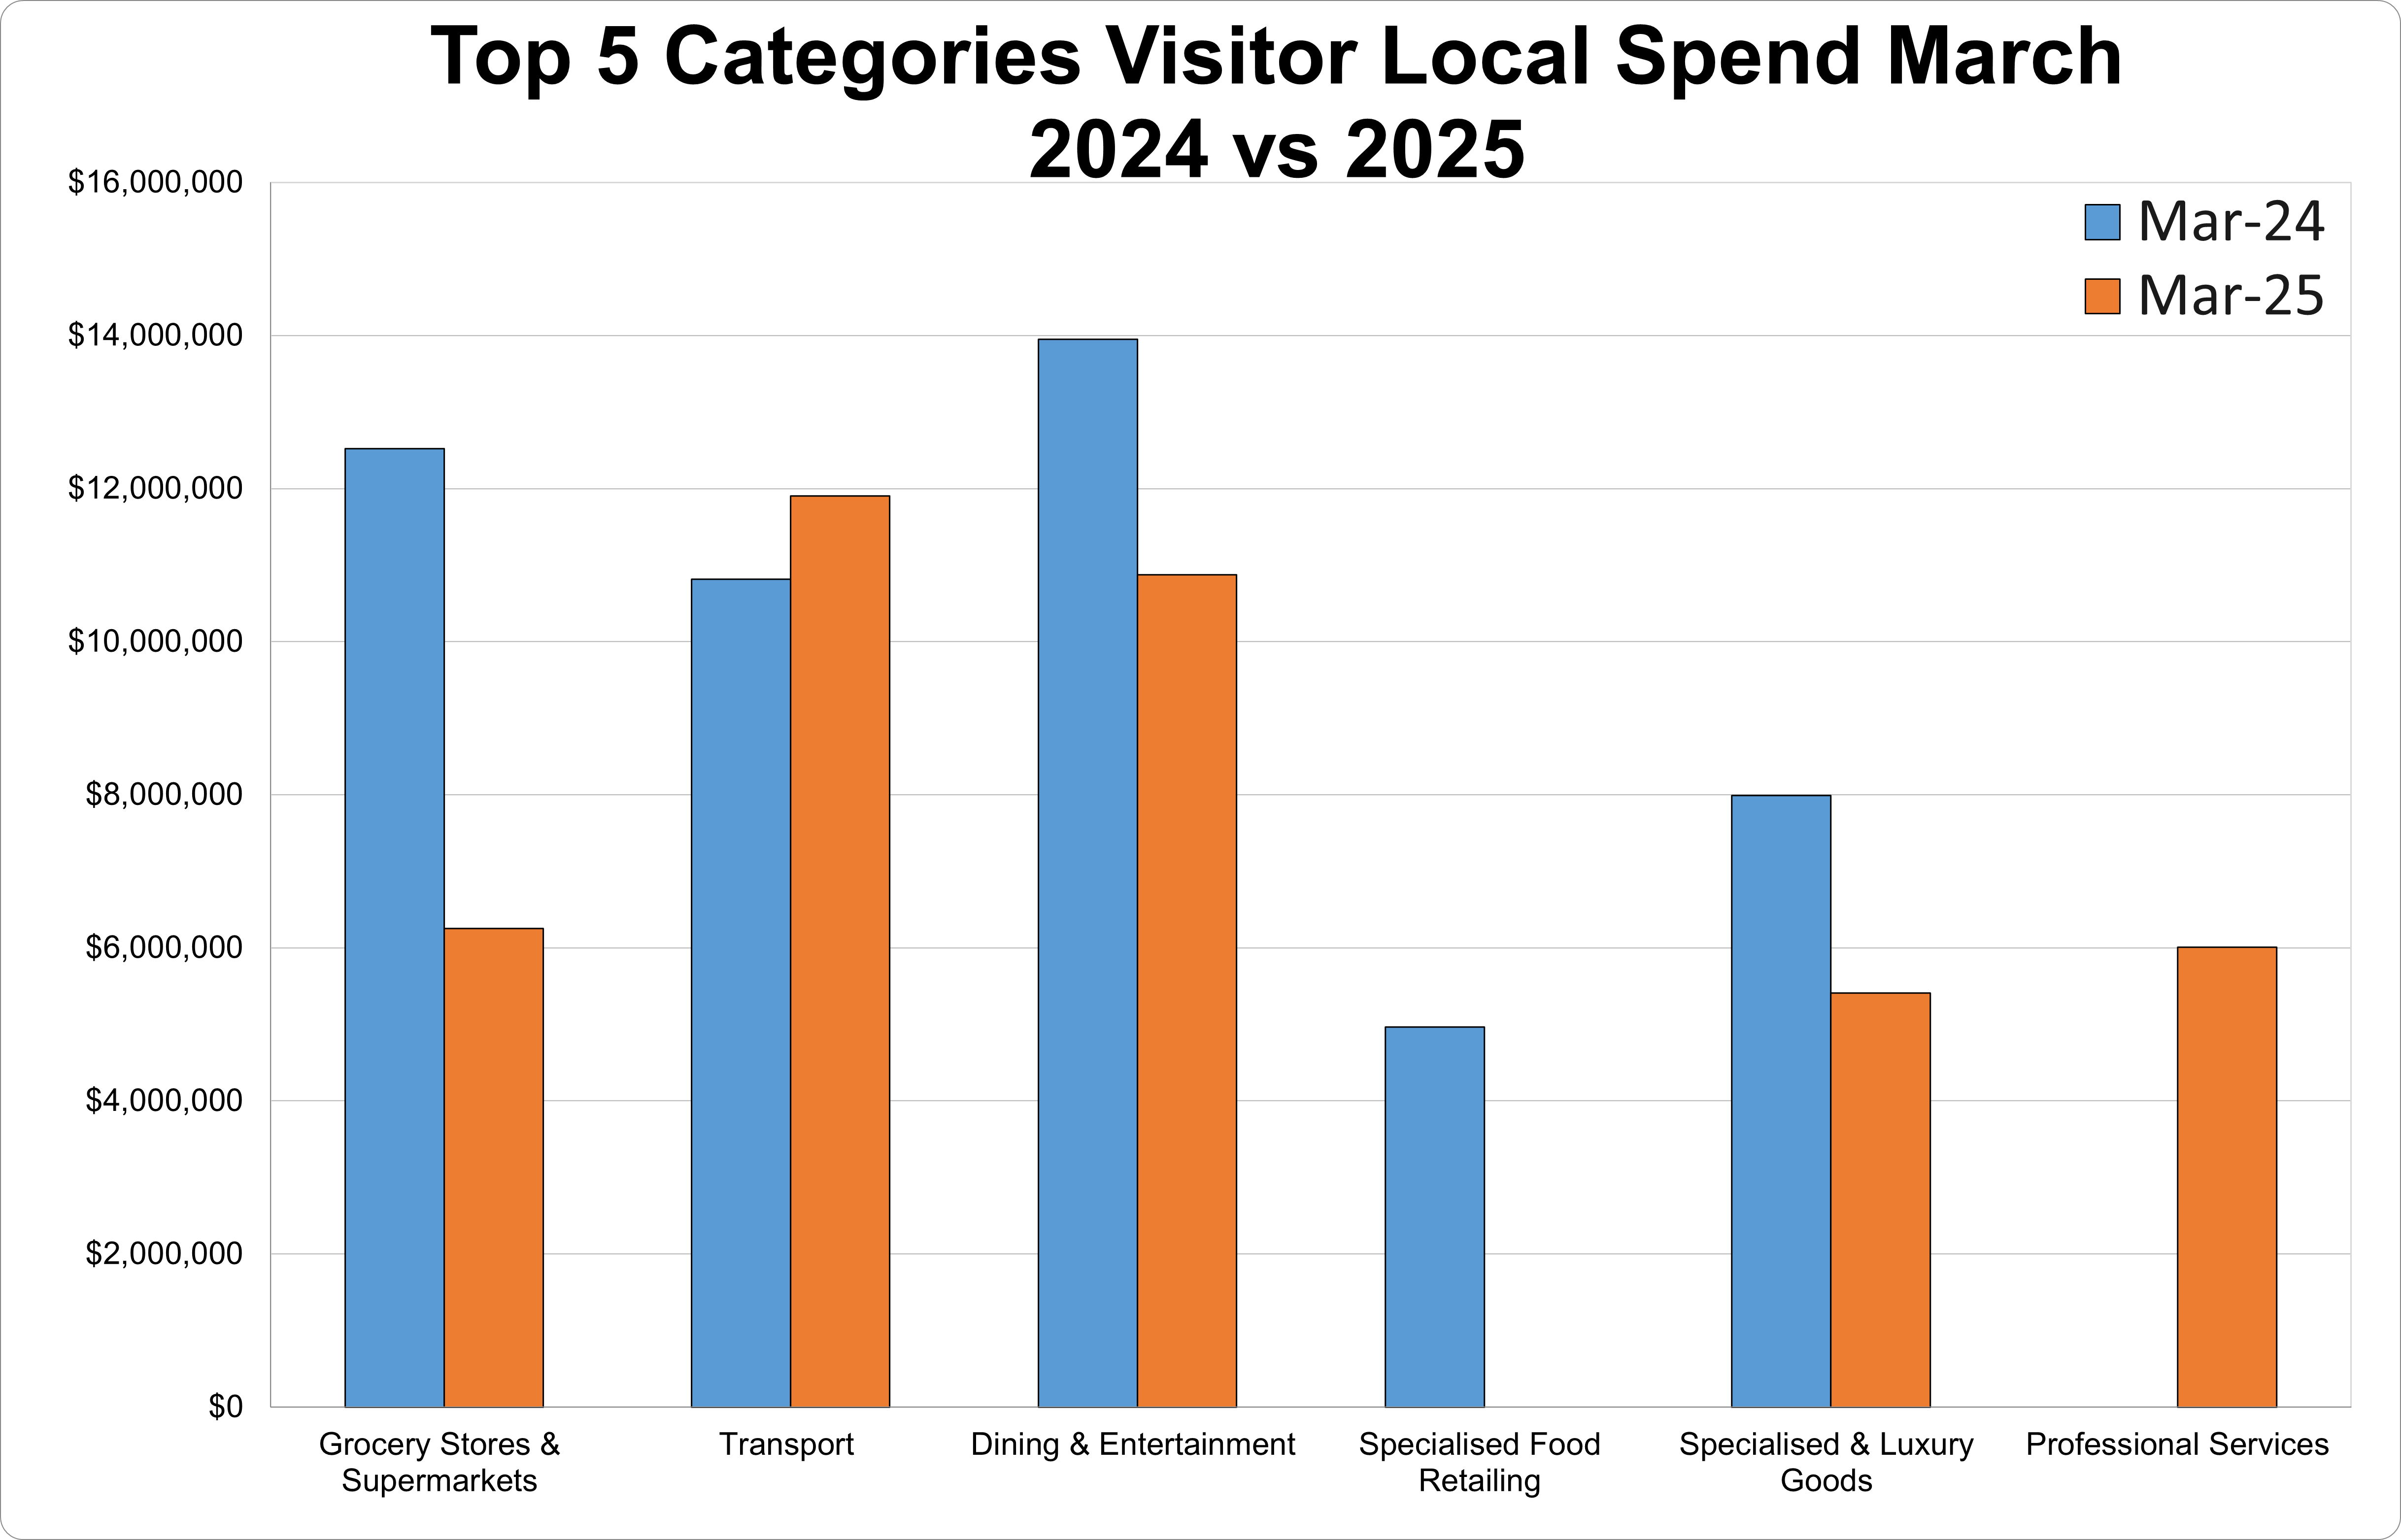
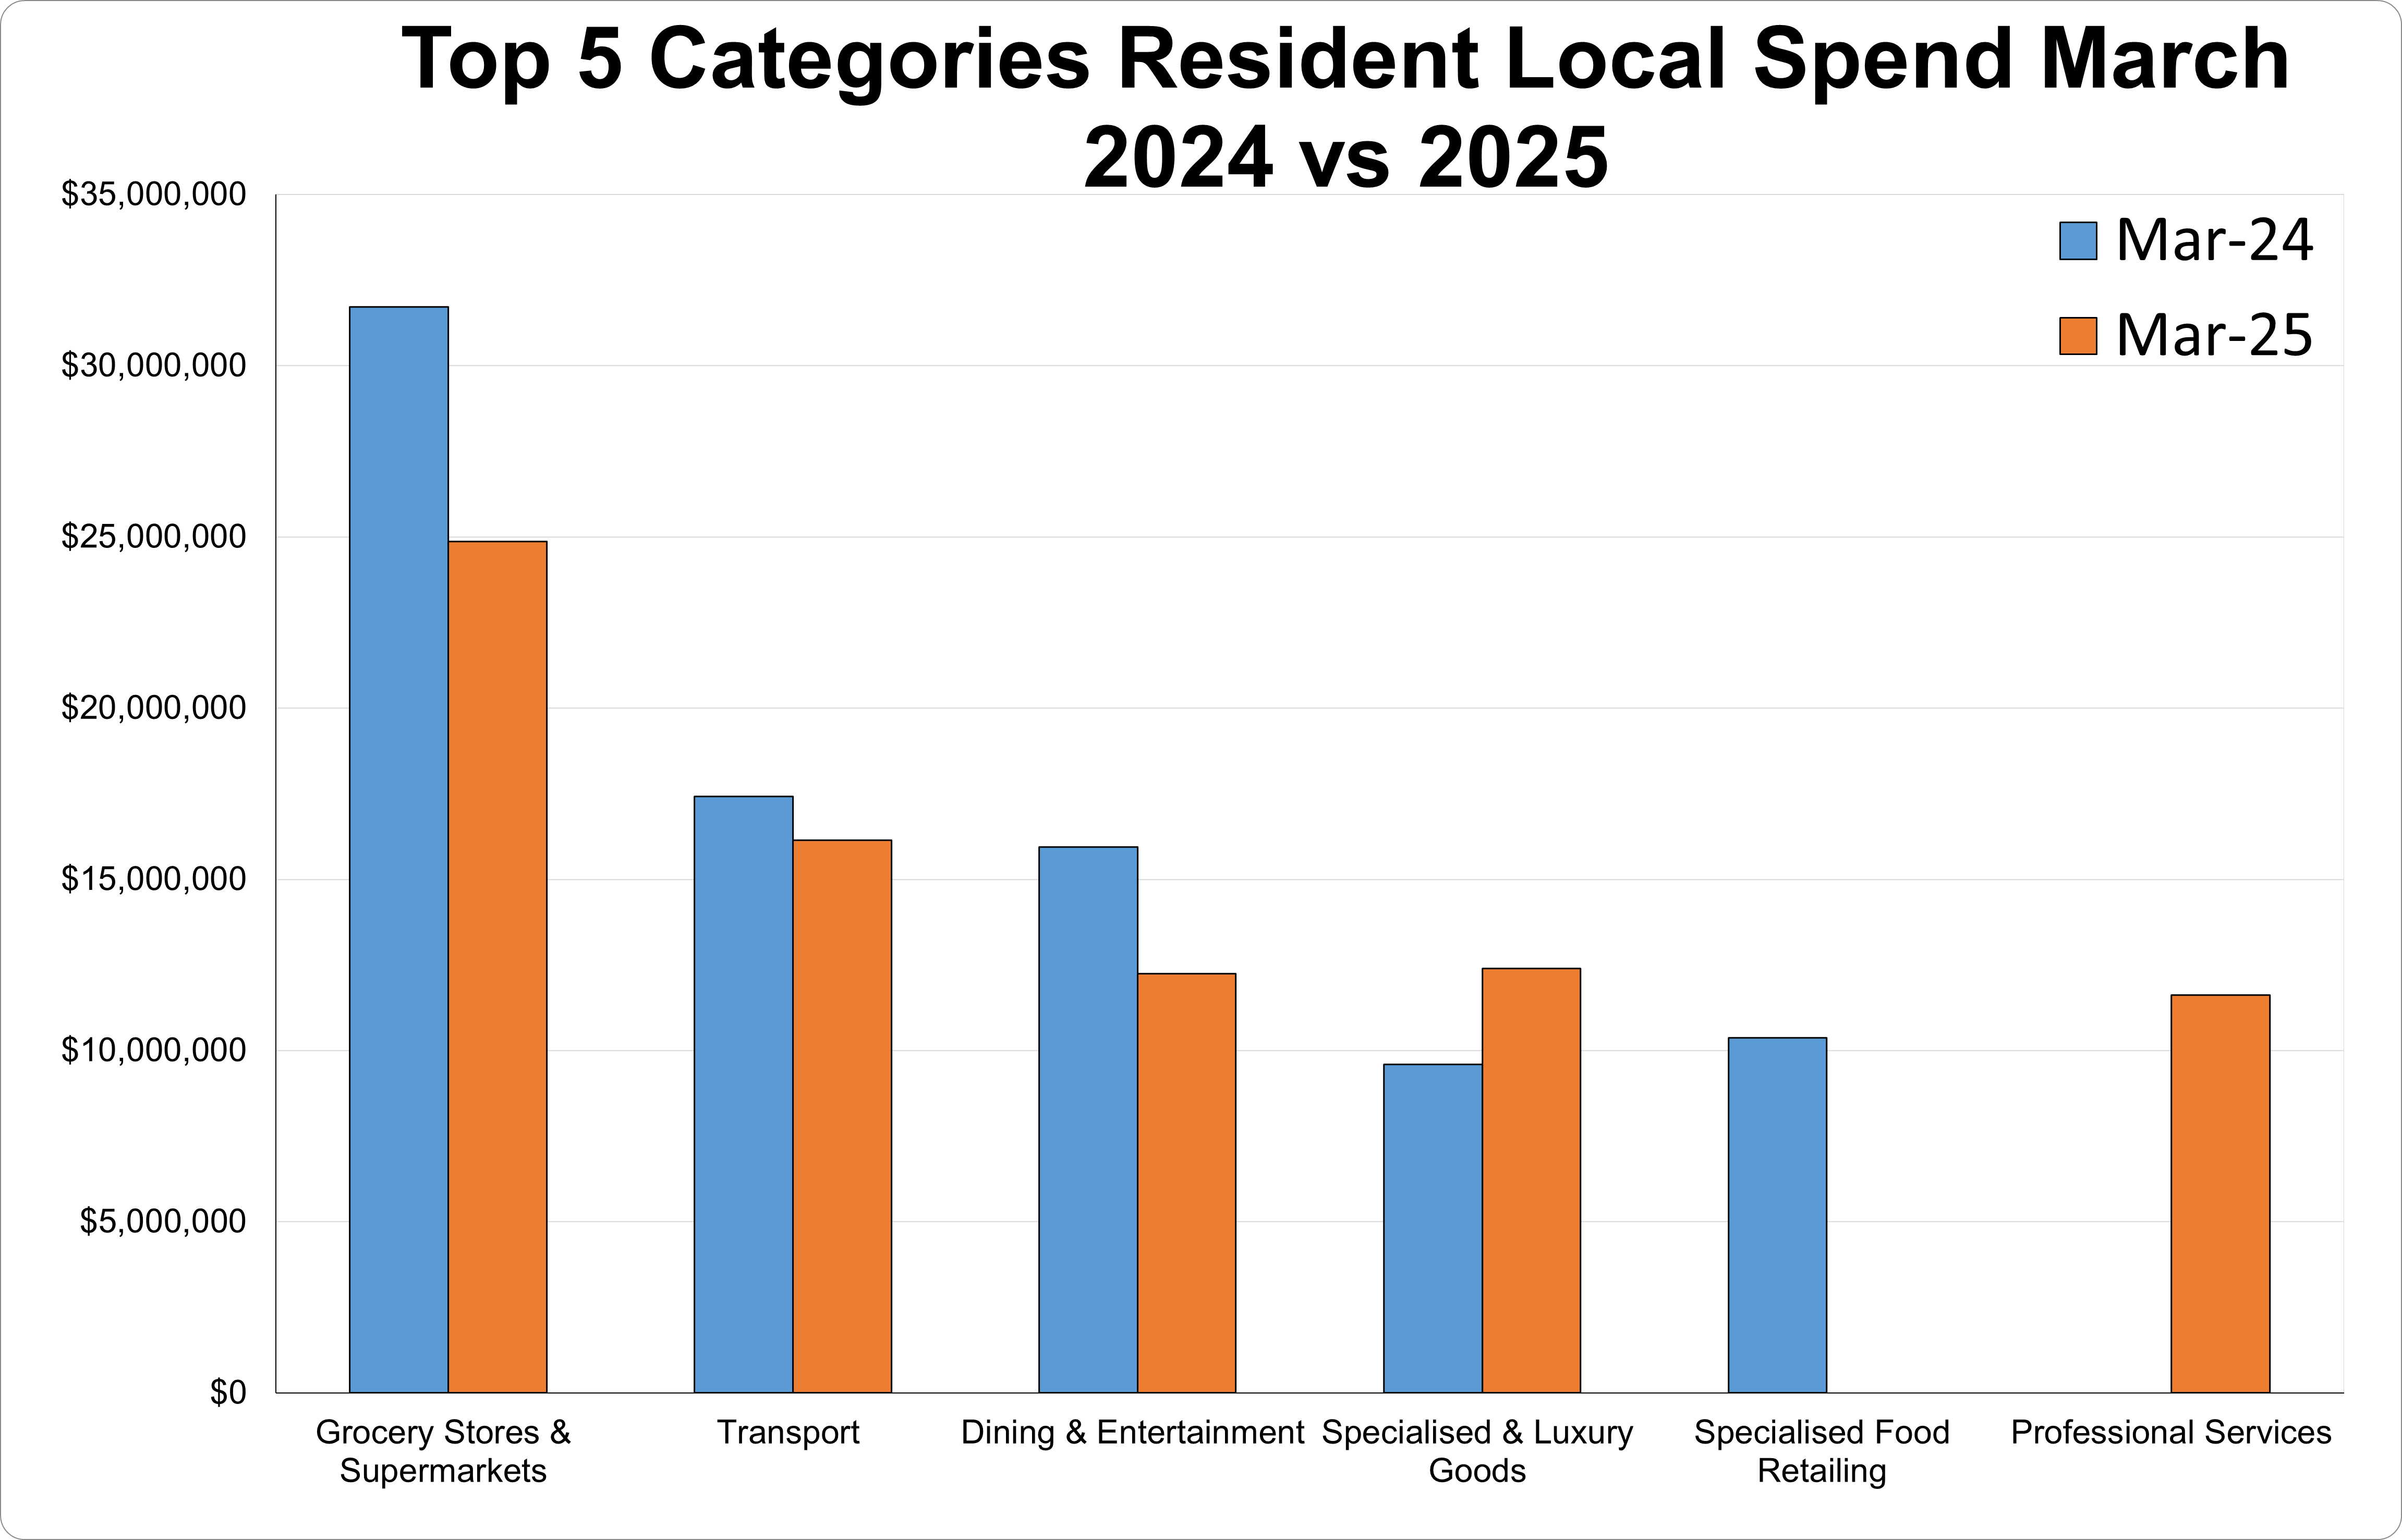
March 2025
Check out the March 2025 monthly report for a breakdown of Hawkesbury's spending.
- Resident Local Spend was $101.1M. This is a -0.8% decrease from the same time last year.
- Resident Online Spend was $126.8M. This is a 9.86% increase from the same time last year.
- Visitor Local Spend was $55.0M. This is a 8.61% increase from the same time last year.
- Total Local Spend was $156.1M. This is a 2.32% increase from the same time last year.
- Resident Escape Spend was $92.6M. This is a 0.84% increase from the same time last year.
The 9.86 % increase in Resident Online Spend reflects the growing national trend towards online sales. This emphasises the need for a strategy to support local traders in enhancing their online presence.
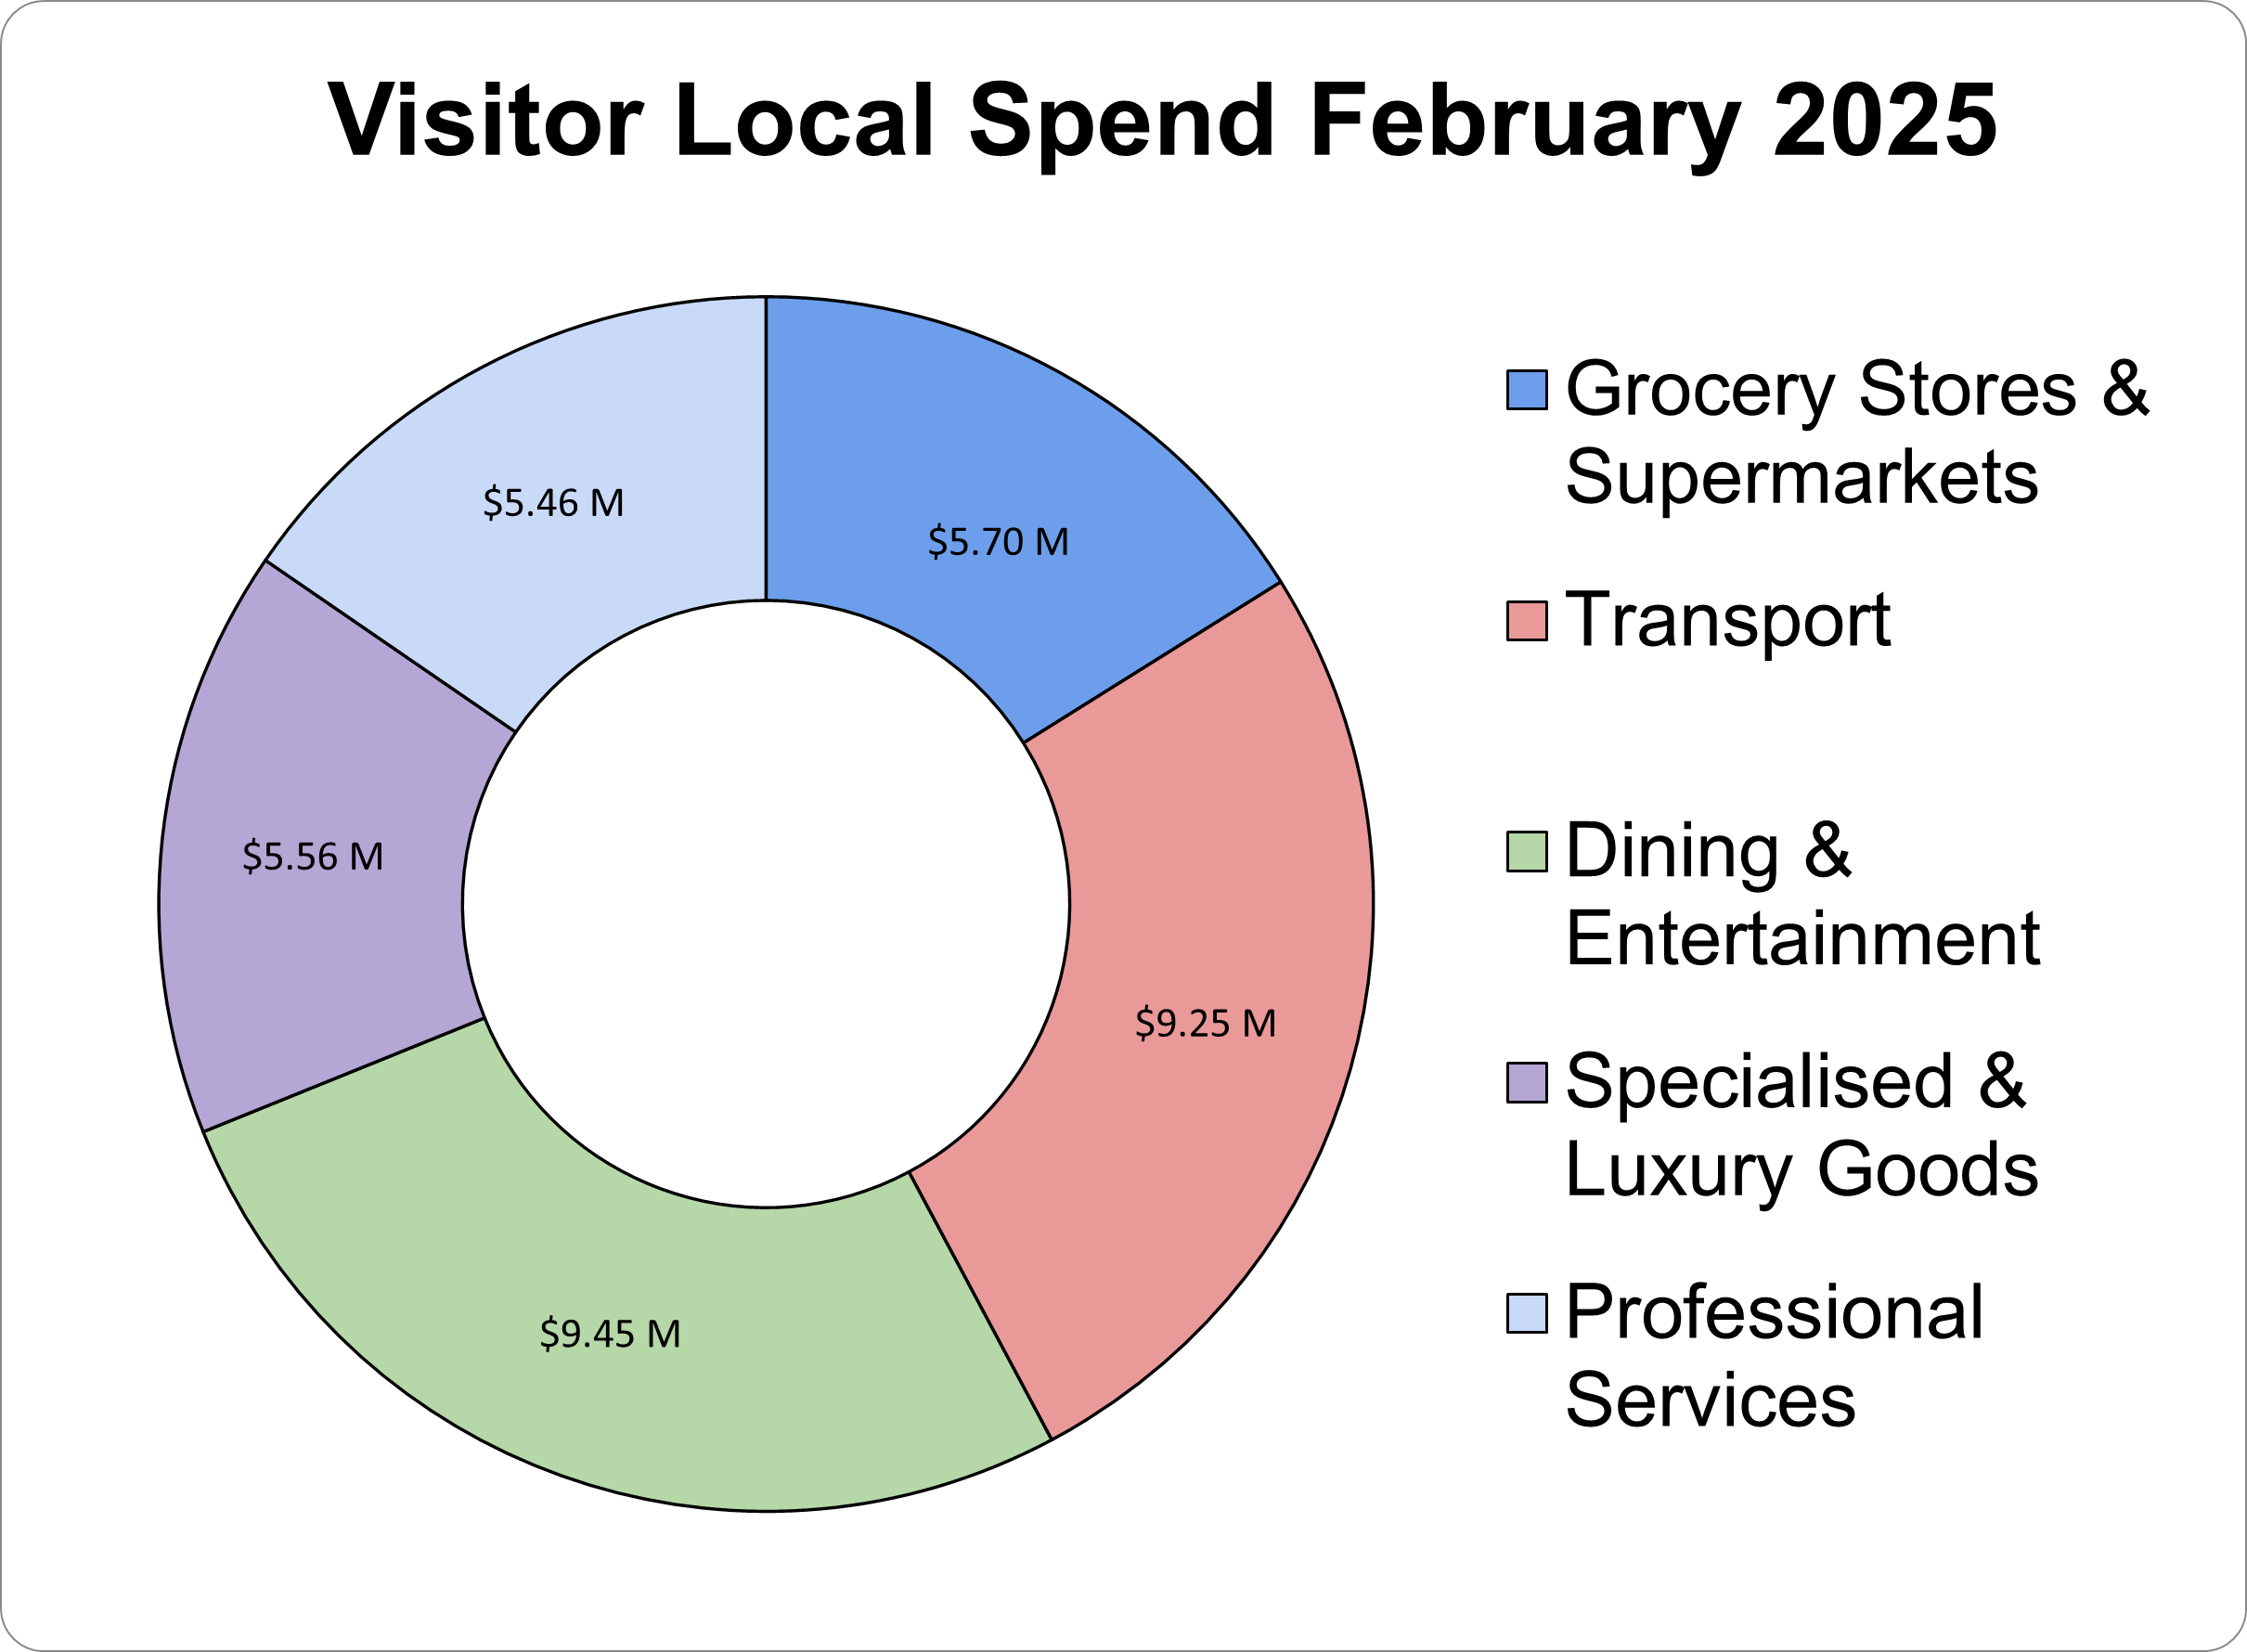
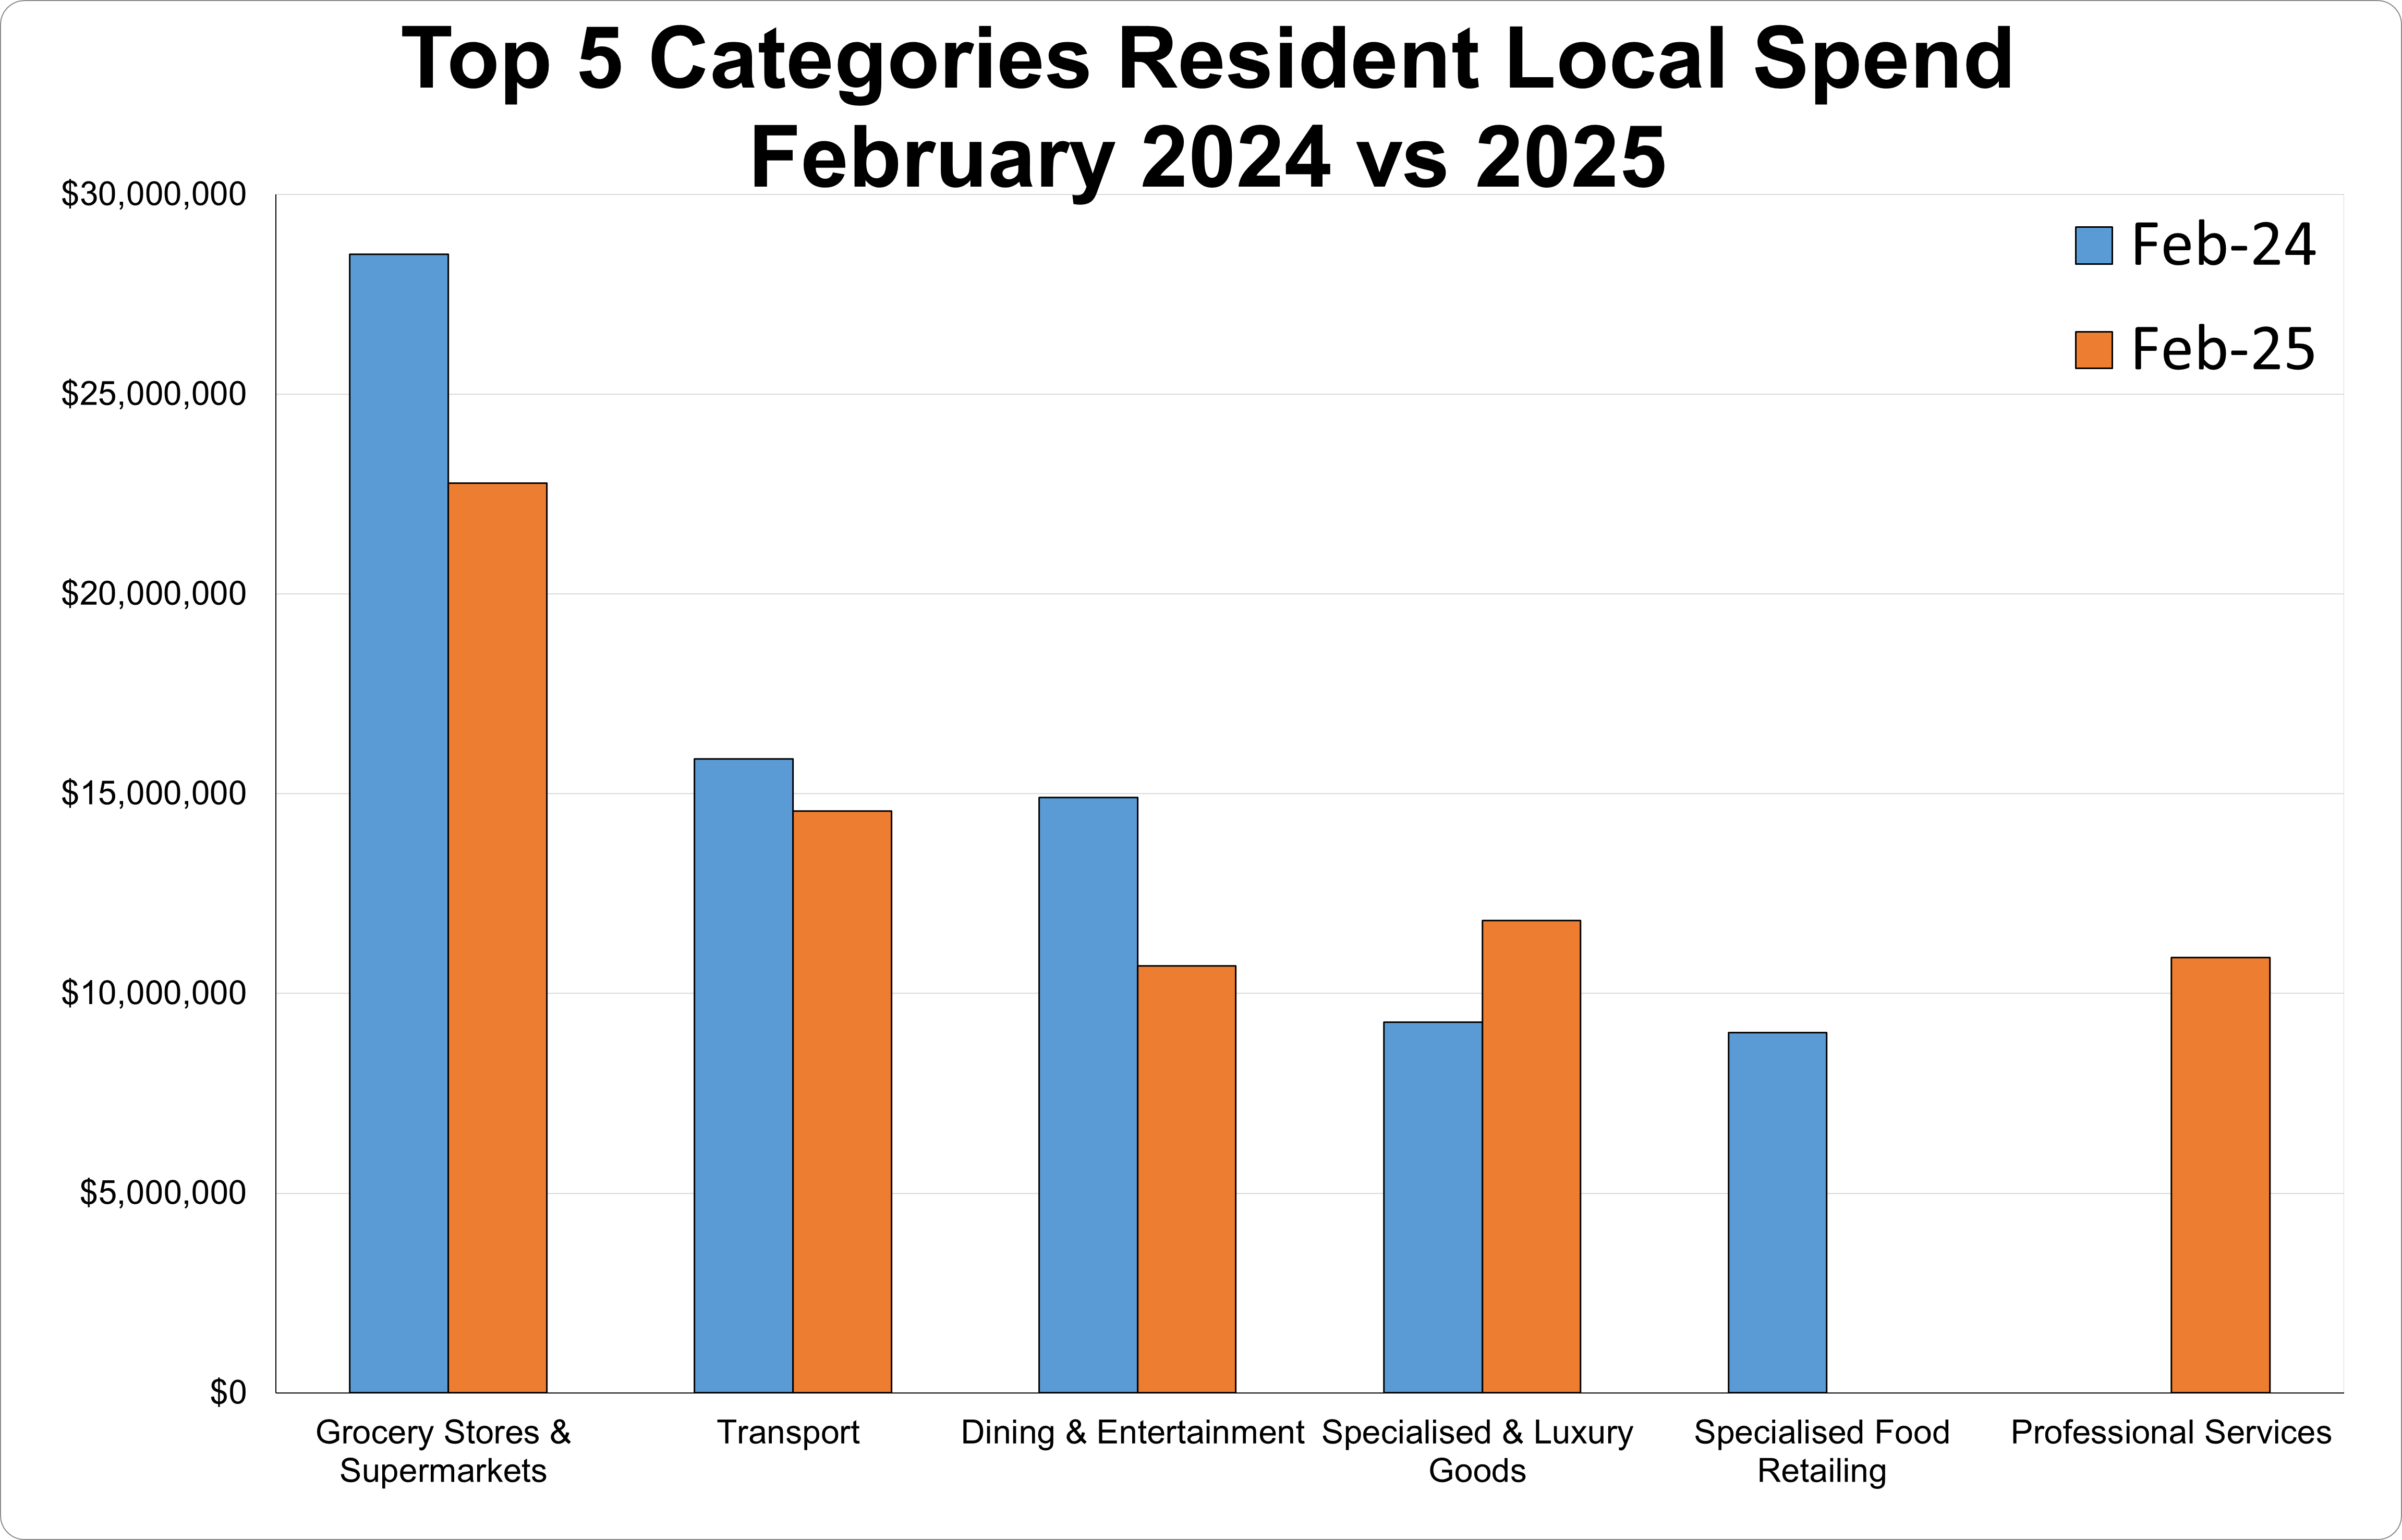
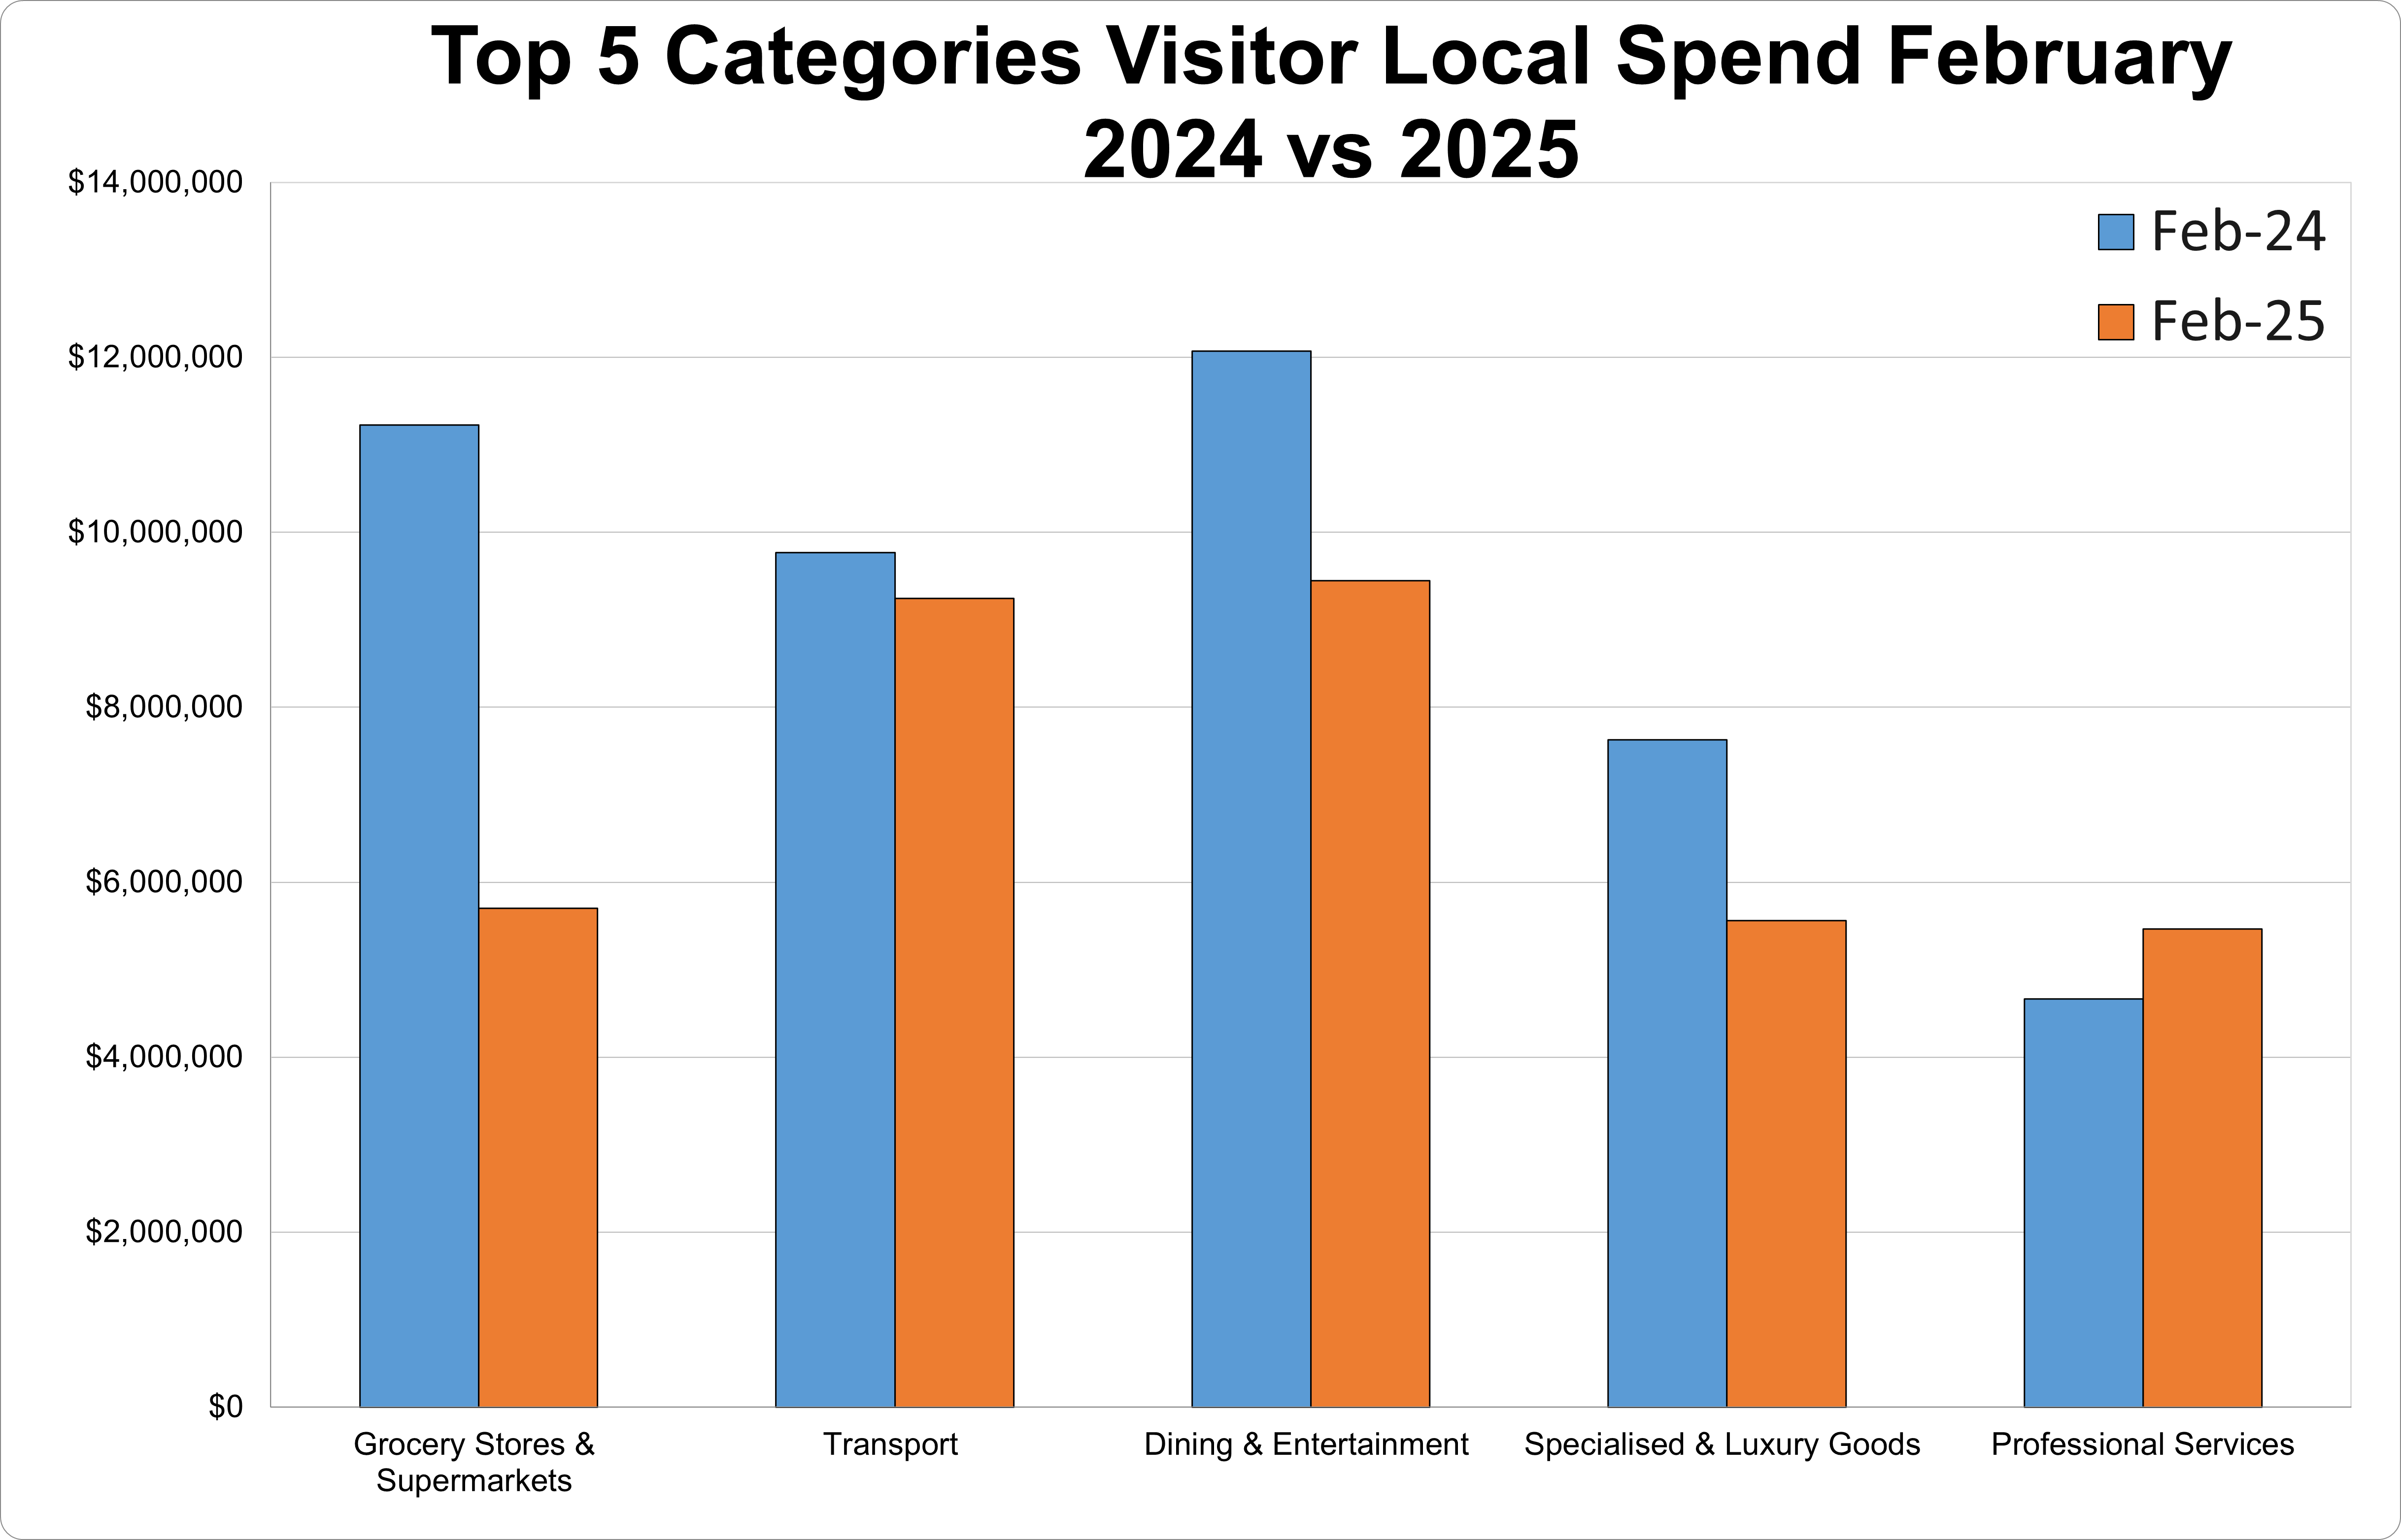
February 2025
Check out the February 2025 monthly report for a breakdown of Hawkesbury's spending.
- Resident Local Spend was $93.1M. This is a -1.49% decrease from the same time last year.
- Visitor Local Spend was $48.3M. This is a 4.31% increase from the same time last year.
- Total Local Spend was $141.4M. This is a 0.41% increase from the same time last year.
- Resident Escape Spend was $83.4M. This is a 0.51% increase from the same time last year.
- Resident Online Spend was $116.4M. This is a 3.57% increase from the same time last year.
The 4.31 % increase in Visitor Local Spend suggests a relatively healthy growth in visitor economy activity.

Page ID: 279474
