
Community Emissions Profile
Achieving Net Zero Emissions
Hawkesbury City Council is using 2016/2017 as a baseline year in which to compare the community’s progress towards our Net Zero Emissions by 2030 or sooner target and to track our water usage.
Where are we now? - 2019/2020
The information below outlines the Hawkesbury Community emissions profile and water usage for the baseline year and for where we are now.
There are two important items to highlight from 2019/2020:
- Residential sector is the largest contributor to both water use (62.1%) and emissions (61.3%). This means the community can have the biggest impact to reduce water use and emissions.
- Electricity and Transport are the largest section of Hawkesbury’s emissions. Therefore, addressing building efficiency, renewable energy and transport will be key to reducing emissions in the Hawkesbury.
The 2019/2020 data is the most recent available data in the Resilient Sydney Platform. This page will be updated when data for 2020/2021 and 2021/2022 is made available.
Hawkesbury’s Overall Residential Emissions – 2019/2020
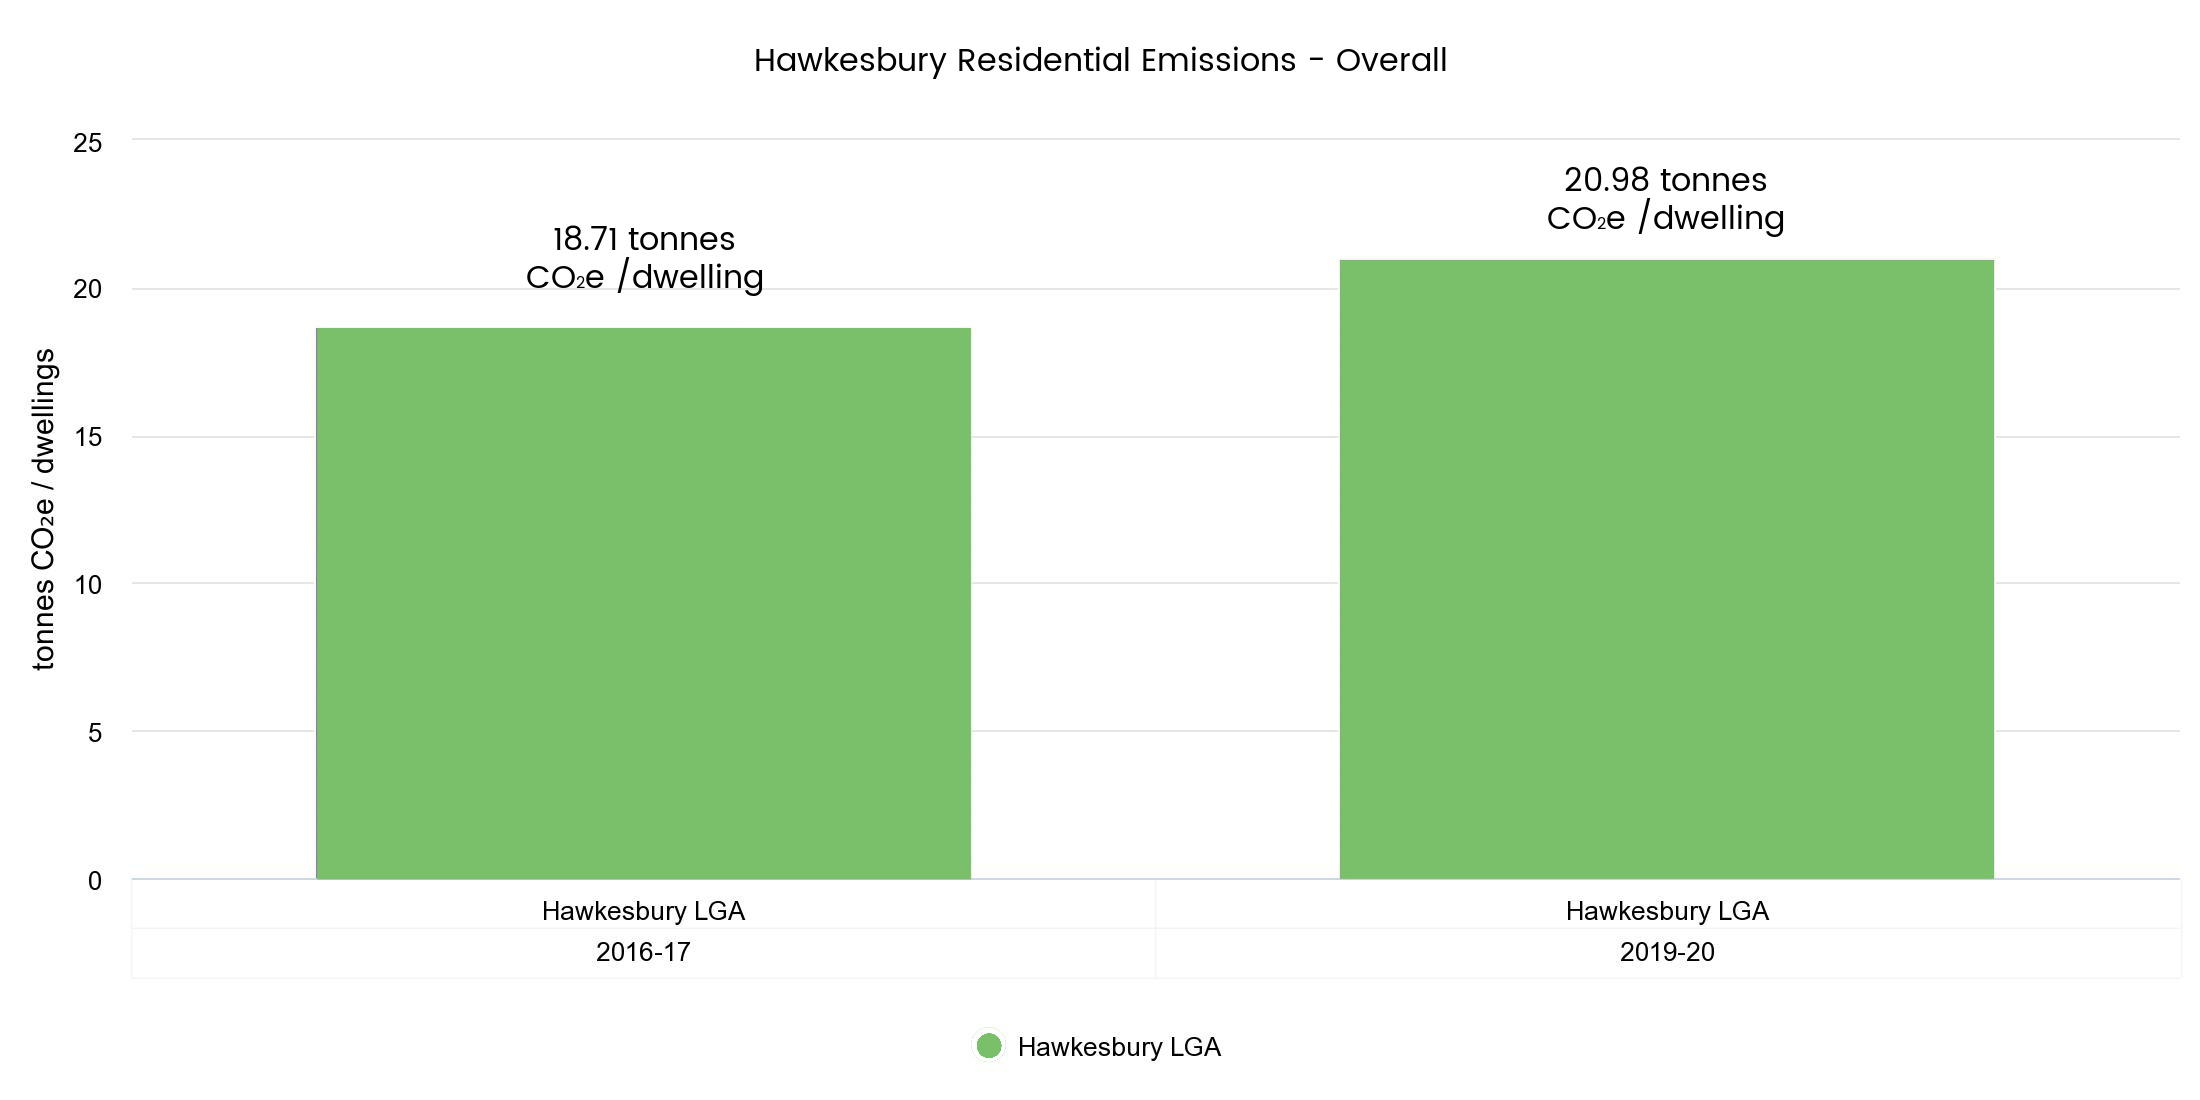
Overall, from 2016/2017 to 2019/2020 residential emissions in the Hawkesbury have increased.
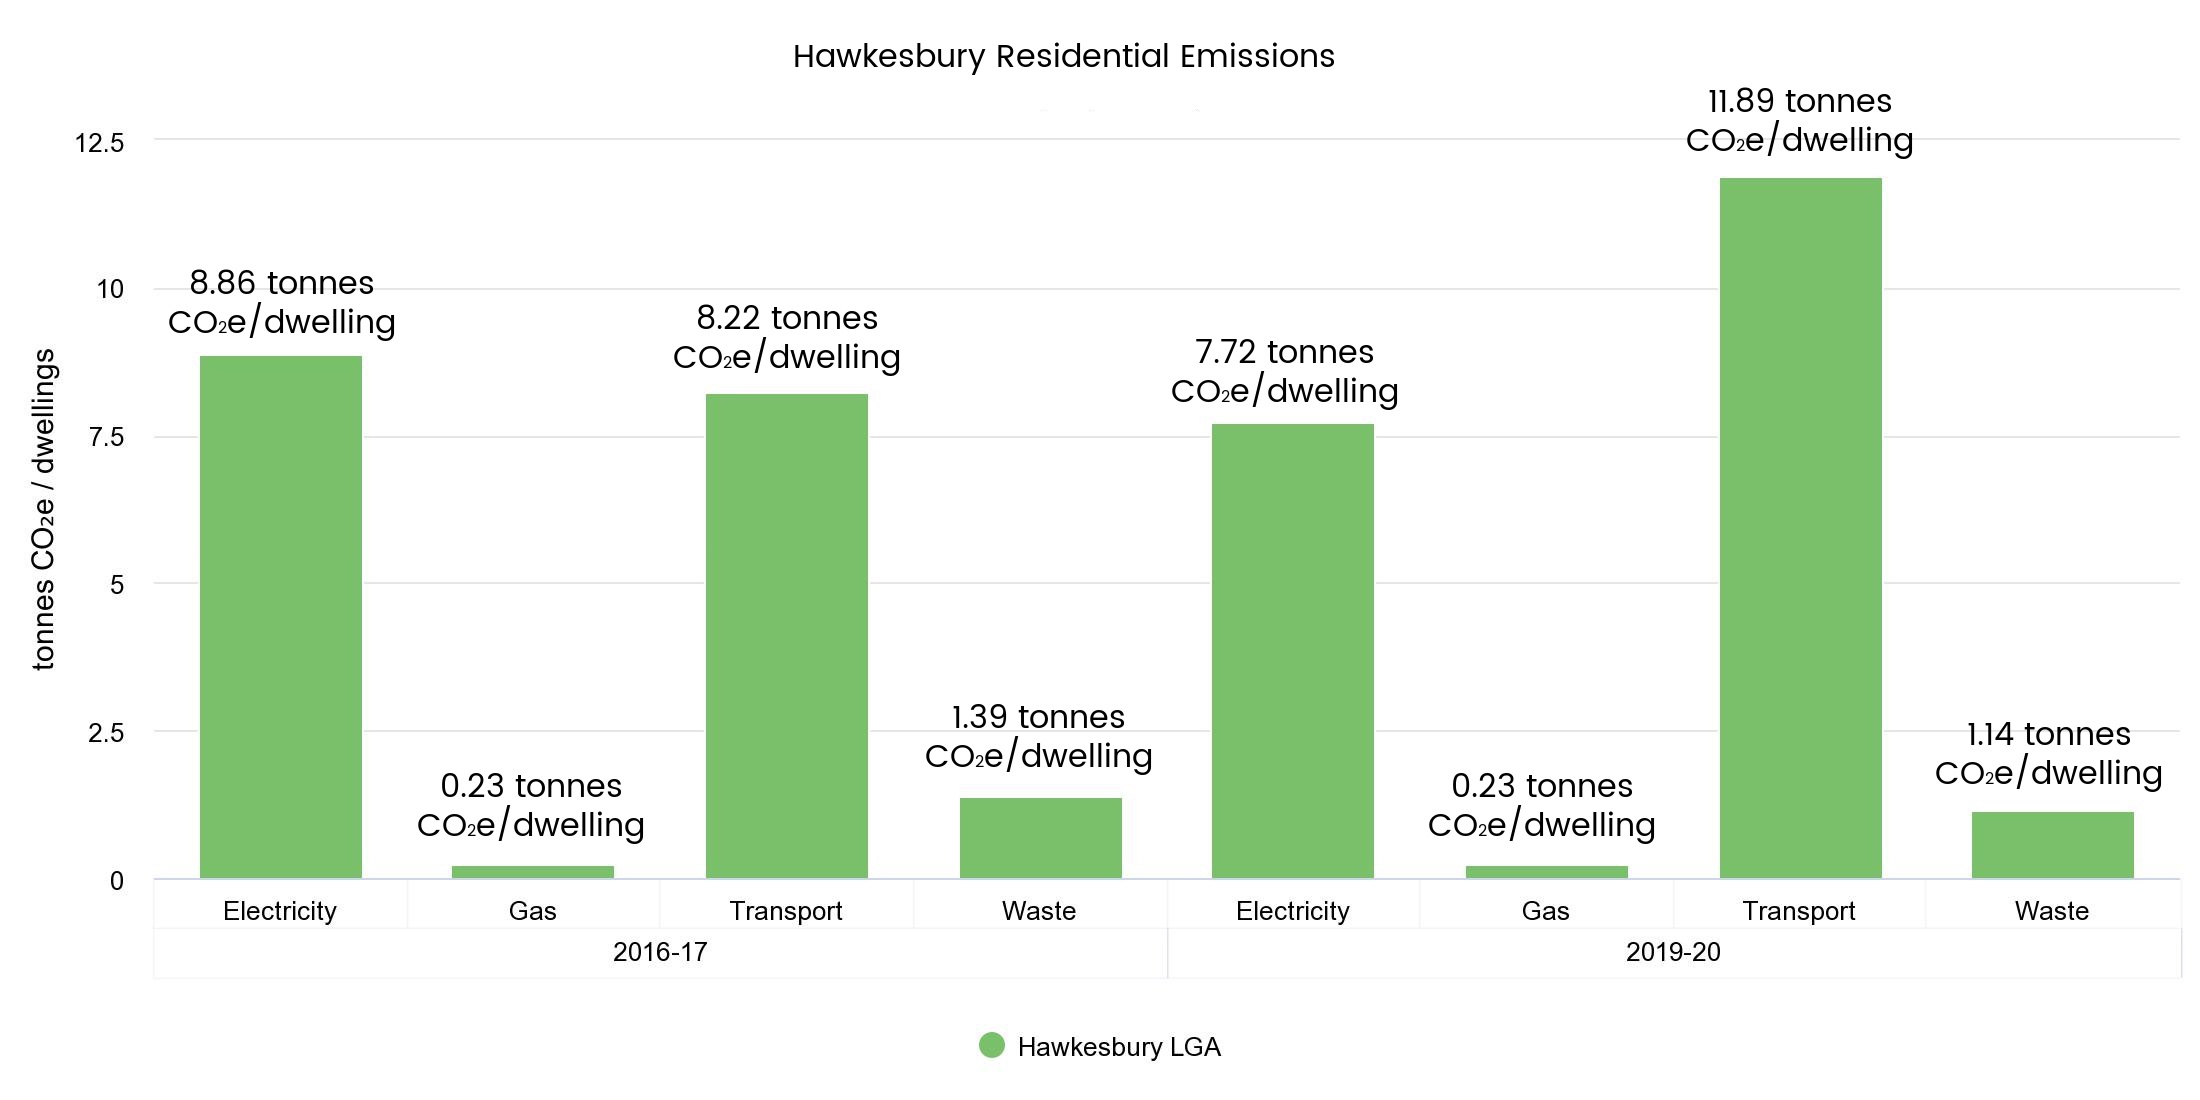
Important items to highlight from the below table is that:
- emissions from electricity and waste decreased
- emissions from gas were stable
- emissions from transport increased
Hawkesbury’s Residential Electricity Use – 2019/2020
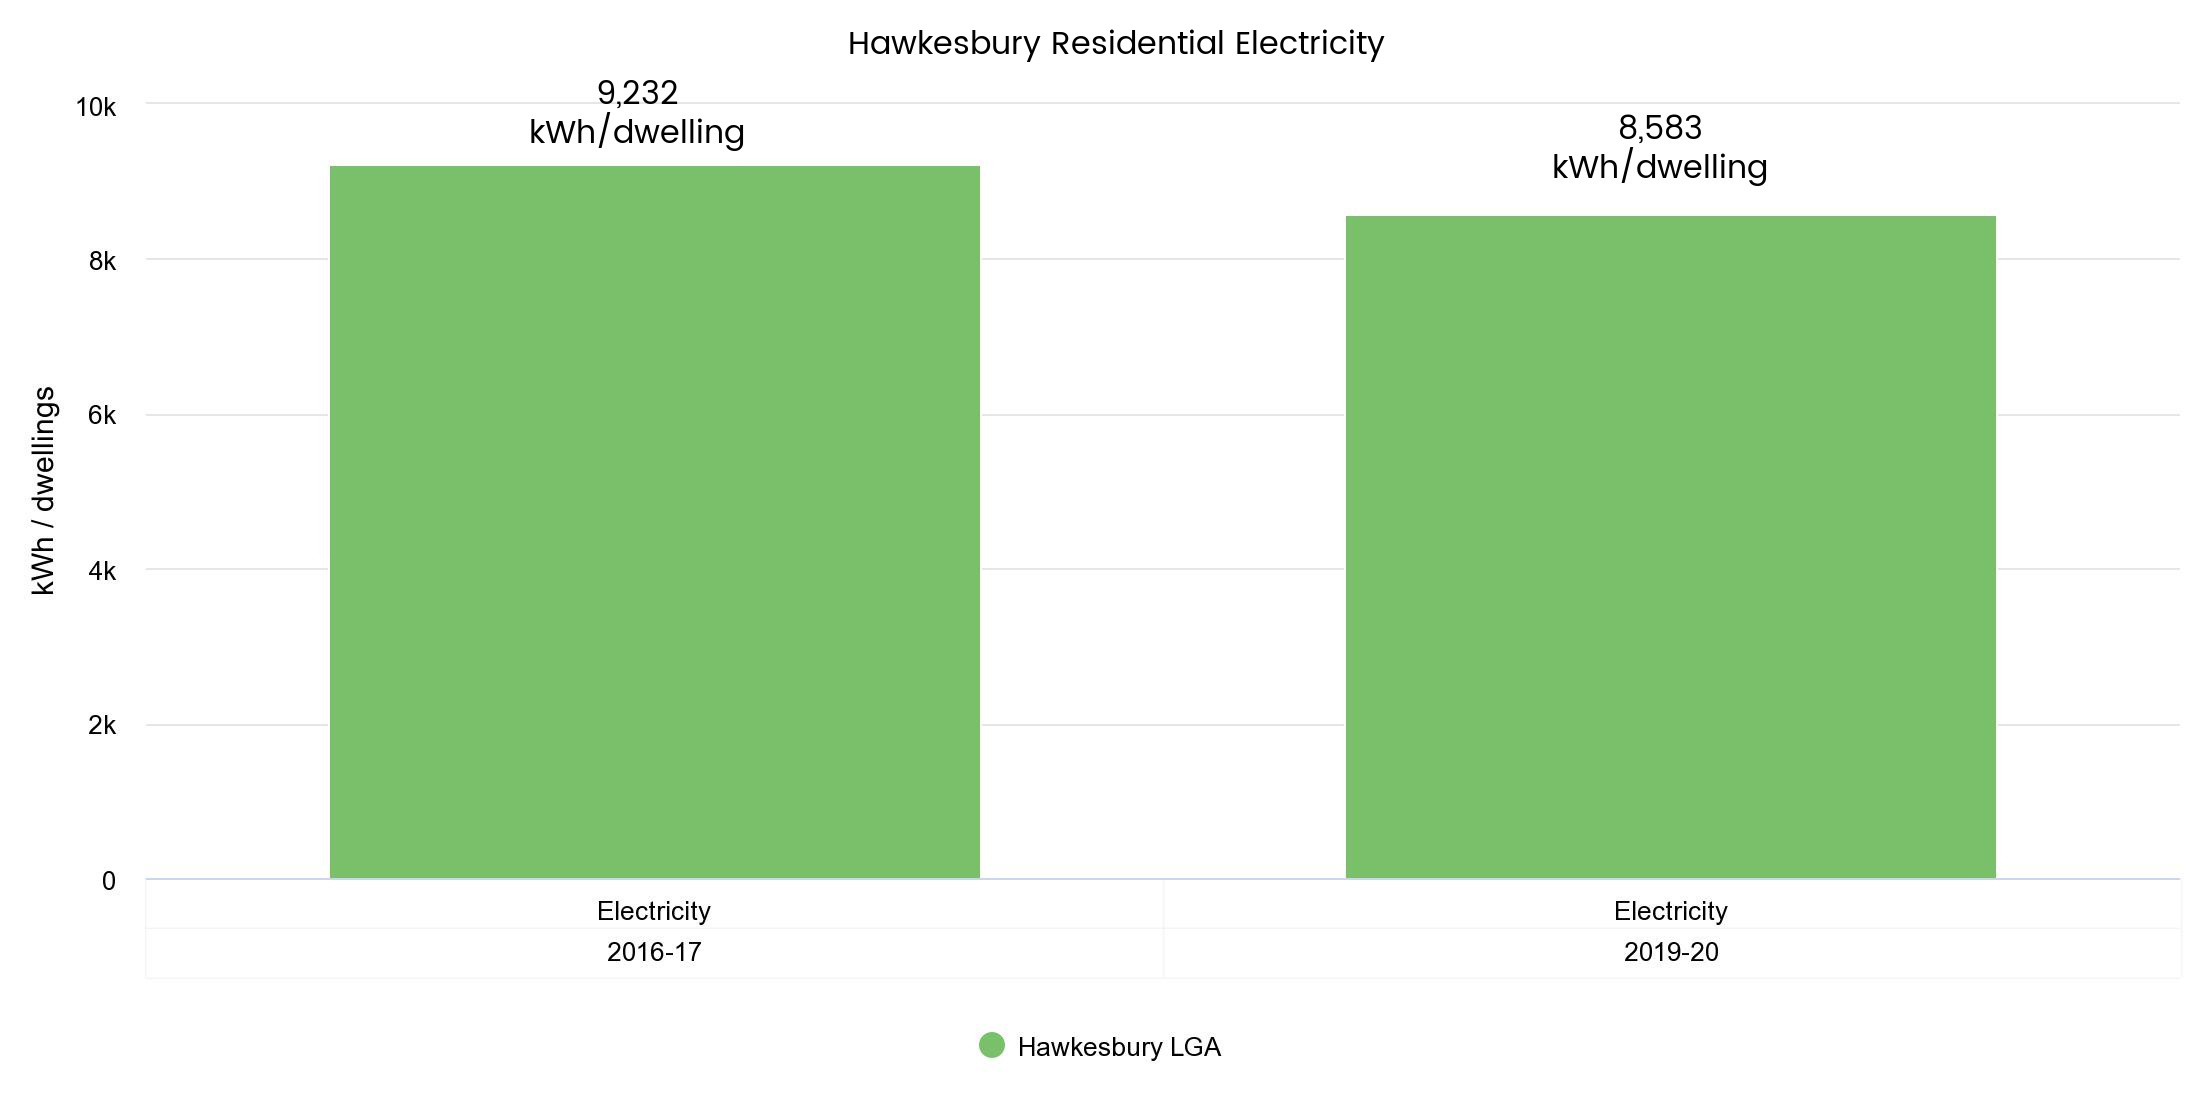
From 2016/2017 to 2019/2020 Hawkesbury residential emissions from electricity use decreased.
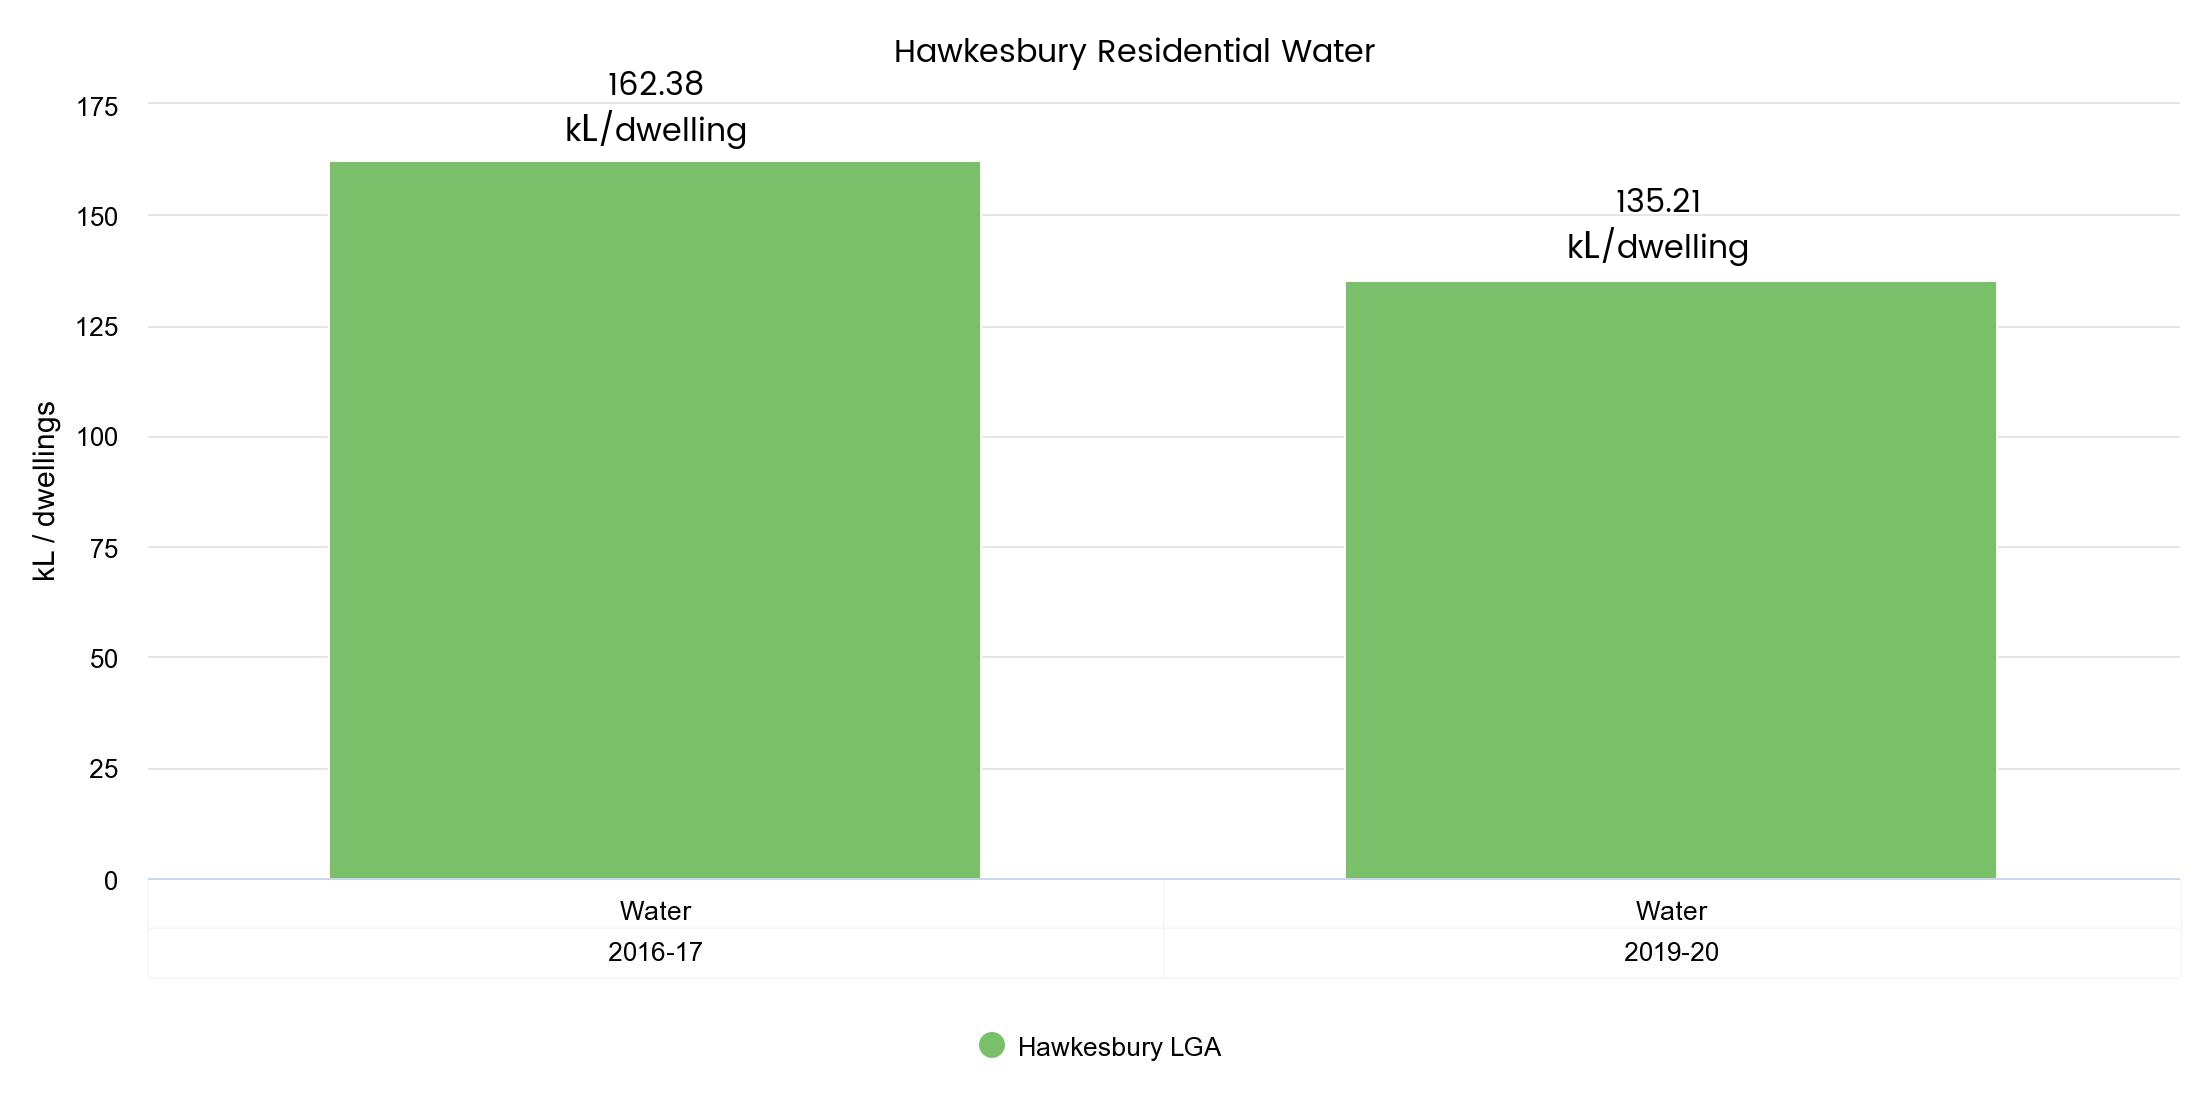
Hawkesbury’s Residential Water Use – 2019/2020
Hawkesbury’s Residential Transport - Km's travelled – 2019/2020
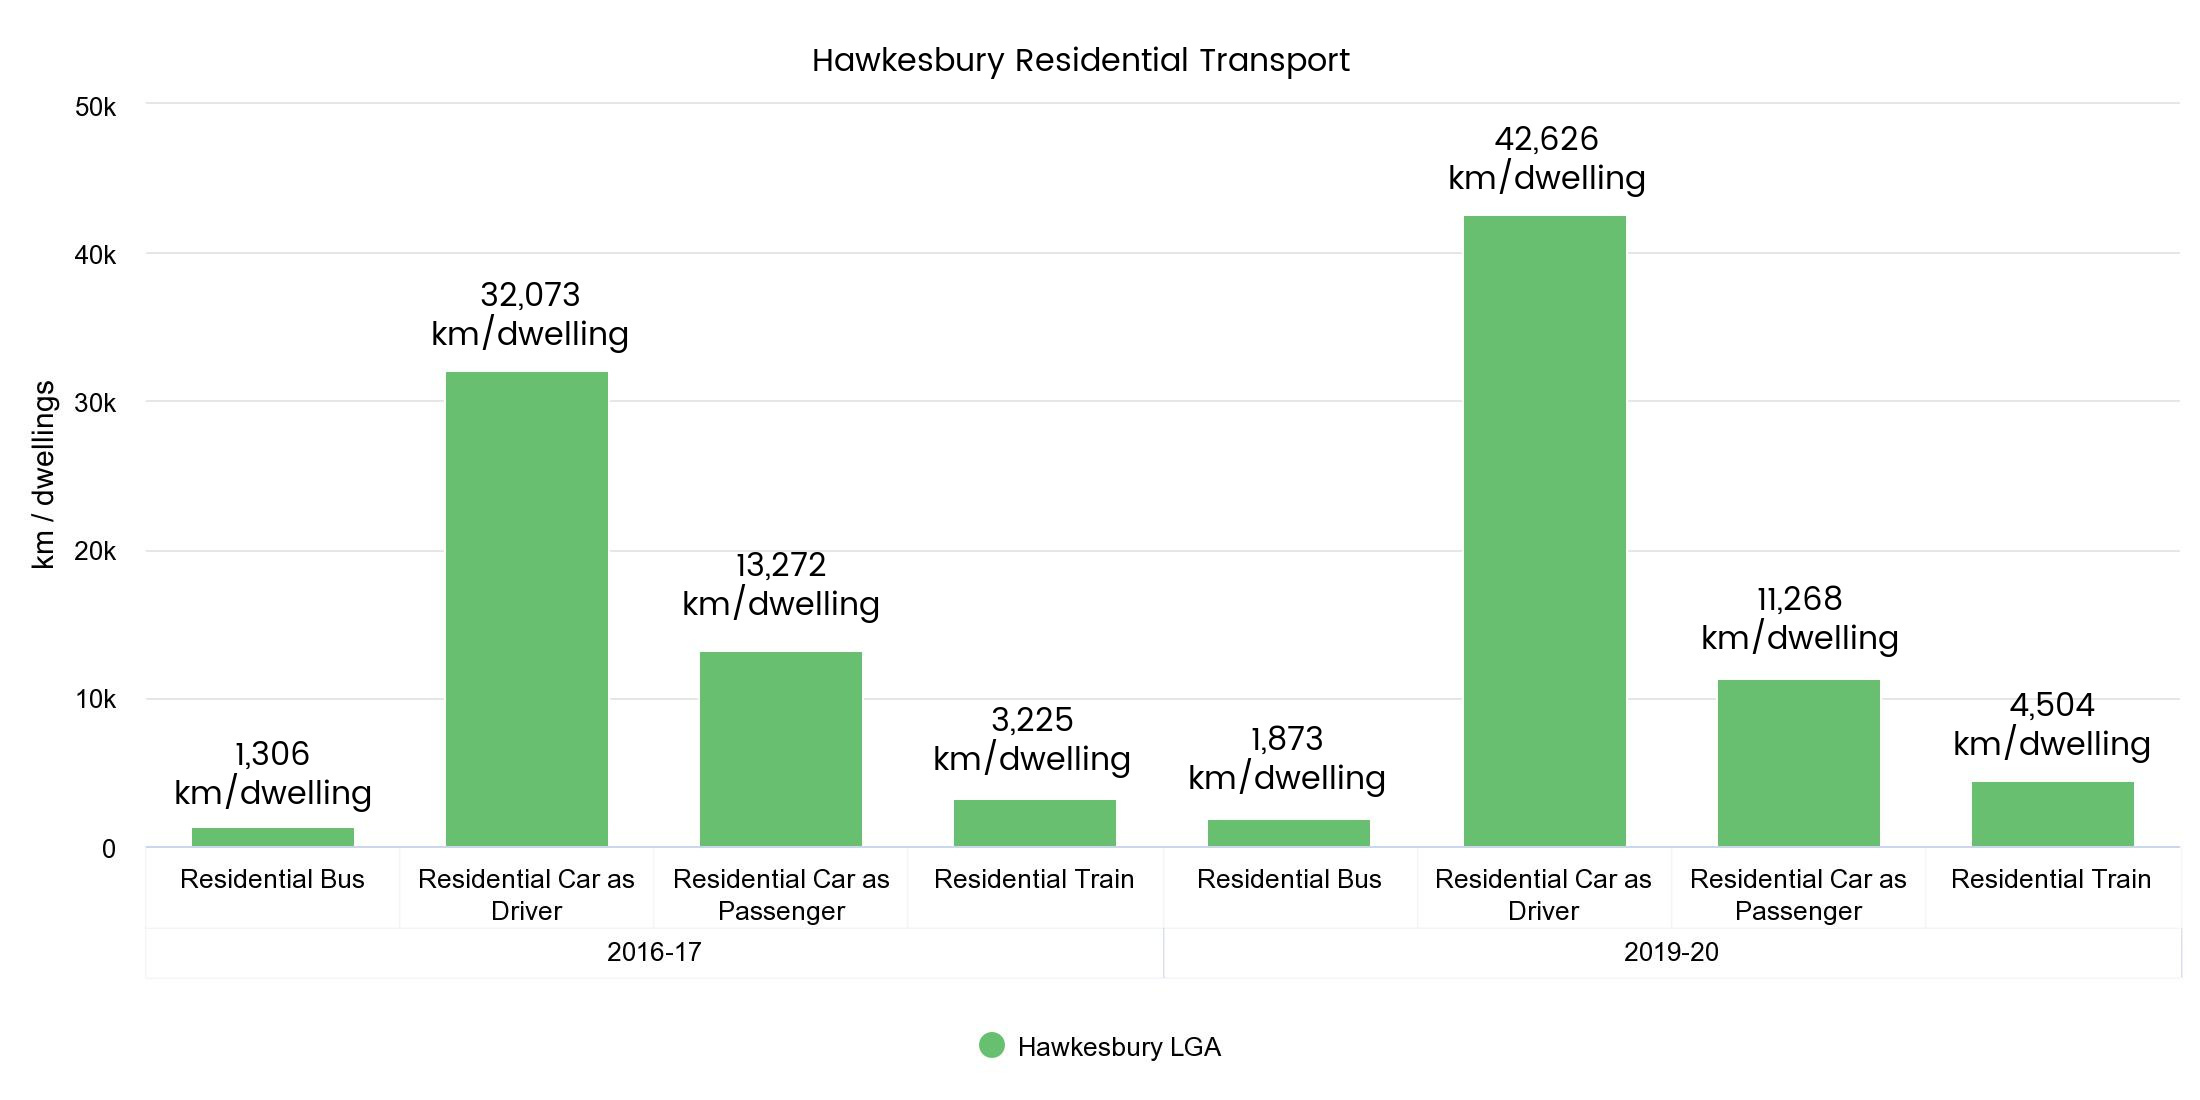
From 2016/2017 to 2019/2020 Hawkesbury residential kilometres travelled from transport increased.
In 2019/2020 Hawkesbury residents had the 2nd highest car use in Greater Sydney in terms of kilometres driven, averaging 42,626 km per dwelling per year compared to the Greater Sydney average of 16,725 km per dwelling per year.
Analysis of car ownership in 2021 indicated 66% of households in the Hawkesbury LGA had access to two or more motor vehicles, compared to 46% in Greater Sydney.
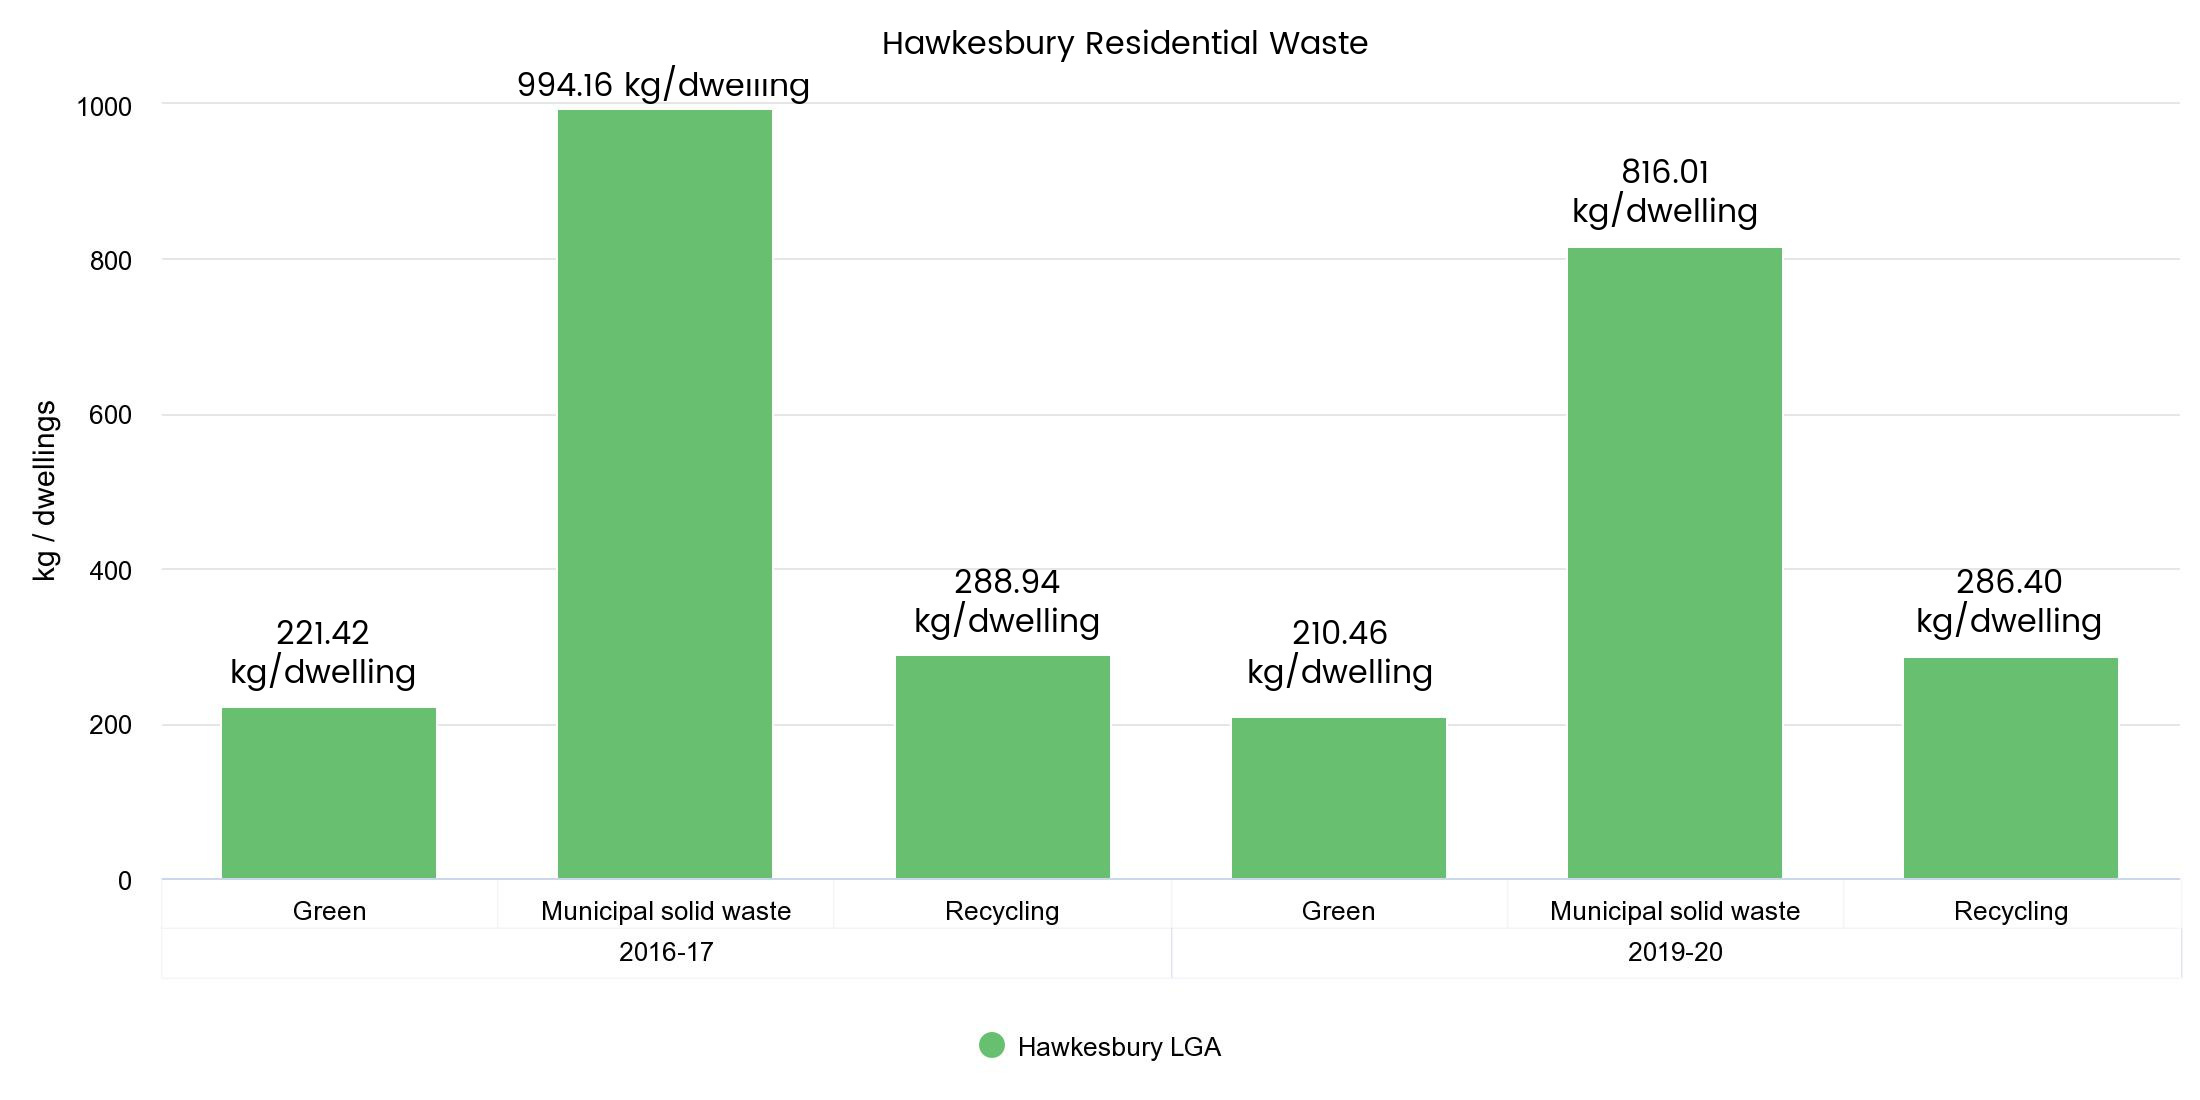
Hawkesbury’s Residential Waste Generation – 2019/2020
Data sources:
This data was sourced through the Resilient Sydney Platform, under the Resilient Sydney Program.
Page ID: 160566
